By world 🌍 Forex’ Traders Hello 👋 traders
"Gold Market Analysis 💡
4H Time Frame Chart 📊
_Bearish Signal 🚨_
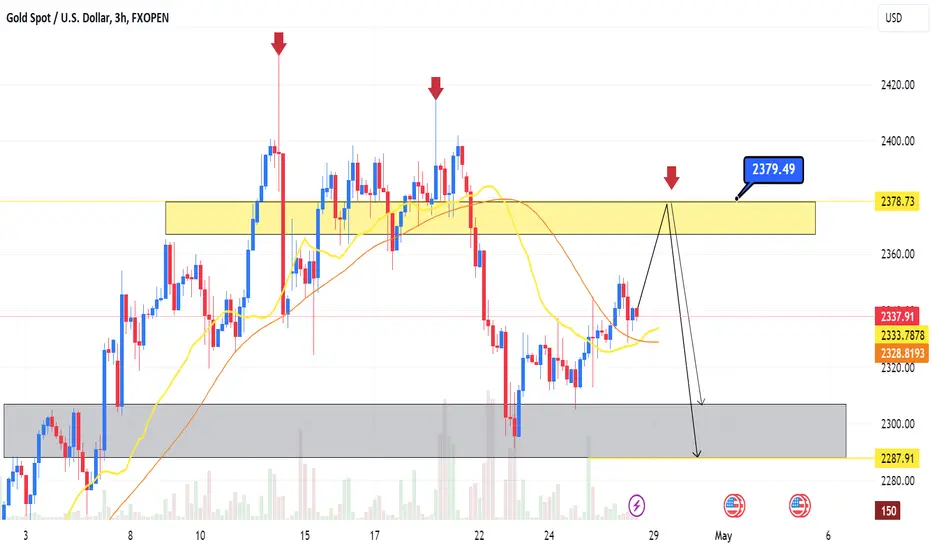
We're seeing a potential short opportunity in the gold market, with a current price of $2378. Our target is $2287, which is a key support level. A breakdown below this level could lead to a significant price drop 💸.
_Analysis 🤔_
The 4H time frame chart shows a bearish trend, with a series of lower highs and lower lows. The Relative Strength Index (RSI) is also indicating a bearish signal, with a reading of [insert RSI value]. The Moving Averages are aligned, providing additional confirmation for a short position 📈.
_Trade Strategy 💰_
Sell: $2378 (short)
Target: $2287 (next support level)
Stop Loss: $2420 (bearish warning) ⚠️
Note: This analysis is based on a 4H time frame chart and is subject to market changes and fluctuations. Always use proper risk management techniques and consult with a financial advisor if necessary.
Follow me for more market insights and analysis! #goldmarket #forex #tradingview 💼"
"Gold Market Analysis 💡
4H Time Frame Chart 📊
_Bearish Signal 🚨_
We're seeing a potential short opportunity in the gold market, with a current price of $2378. Our target is $2287, which is a key support level. A breakdown below this level could lead to a significant price drop 💸.
_Analysis 🤔_
The 4H time frame chart shows a bearish trend, with a series of lower highs and lower lows. The Relative Strength Index (RSI) is also indicating a bearish signal, with a reading of [insert RSI value]. The Moving Averages are aligned, providing additional confirmation for a short position 📈.
_Trade Strategy 💰_
Sell: $2378 (short)
Target: $2287 (next support level)
Stop Loss: $2420 (bearish warning) ⚠️
Note: This analysis is based on a 4H time frame chart and is subject to market changes and fluctuations. Always use proper risk management techniques and consult with a financial advisor if necessary.
Follow me for more market insights and analysis! #goldmarket #forex #tradingview 💼"
Trade active
Note
Trade active
Trade active
Note
chek it new analysisTrade active
Trade closed: target reached
"Trade Update 📊Target 2 hit! 🎯
+700 pips achieved! 🚀
Done! 👍🏻
Thanks for the support and comments! I'm glad to be a part of your trading journey and help analyze the market to support your hard work. Keep shining! 💫
Remember, profits are the result of dedication and smart trading decisions. You got this! 💪
Keep me posted on your next target, and let's keep analyzing the market together! 📈
Note
CHAEK IT NEW ANALYSIS(Services:✔️ JOIN Telegram channel
t.me/SMCTrading_point
Gold trading signals 🚀 99%
t.me/SMCTrading_point
Join my recommended broker , link 👇
World best broker exness ✅D
one.exnesstrack.org/a/l1t1rf3p6v
t.me/SMCTrading_point
Gold trading signals 🚀 99%
t.me/SMCTrading_point
Join my recommended broker , link 👇
World best broker exness ✅D
one.exnesstrack.org/a/l1t1rf3p6v
Related publications
Disclaimer
The information and publications are not meant to be, and do not constitute, financial, investment, trading, or other types of advice or recommendations supplied or endorsed by TradingView. Read more in the Terms of Use.
(Services:✔️ JOIN Telegram channel
t.me/SMCTrading_point
Gold trading signals 🚀 99%
t.me/SMCTrading_point
Join my recommended broker , link 👇
World best broker exness ✅D
one.exnesstrack.org/a/l1t1rf3p6v
t.me/SMCTrading_point
Gold trading signals 🚀 99%
t.me/SMCTrading_point
Join my recommended broker , link 👇
World best broker exness ✅D
one.exnesstrack.org/a/l1t1rf3p6v
Related publications
Disclaimer
The information and publications are not meant to be, and do not constitute, financial, investment, trading, or other types of advice or recommendations supplied or endorsed by TradingView. Read more in the Terms of Use.