📊 Market Overview:
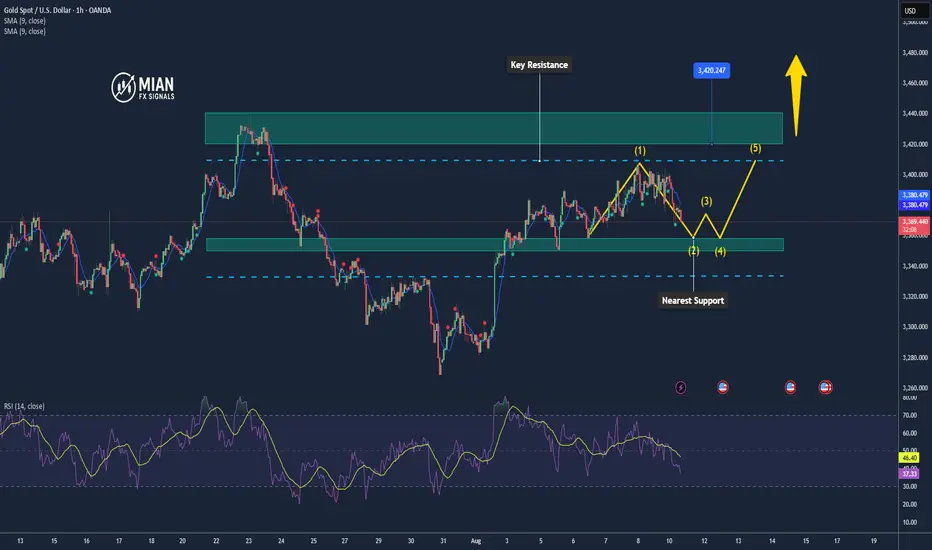
Gold on the H1 chart is consolidating between $3,375 and $3,404, with buying and selling pressure balanced ahead of U.S. CPI data. Narrow H1 candles suggest imminent volatility.
📉 Technical Analysis:
• Key Resistance: $3.400–$3.410
• Nearest Support: $3.358–$3.351
• EMA: Price hovering around EMA 50, with EMA 9 crossing below EMA 21 → short-term bias slightly bearish.
• Pattern / Momentum: MACD losing bullish momentum, RSI neutral at 48–50, Inside Bar pattern forming on H1.
📌 Outlook:
• A break below $3.351 could drive gold toward $3.333–$3.321.
• Holding above $3.370 and breaking $3.400 could target $3.410–$3.420.
💡 Suggested Trading Strategy:
🔻 SELL XAU/USD : $3.397–$3.400
🎯 TP: 40/80/200 pips
❌ SL: $3.403
🔺 BUY XAU/USD : $3.352–$3.355
🎯 TP: 40/80/200 pips
❌ SL: $3.349
Trade active
Buying at $3355 is a “bottom-fishing” strategy at a key H1 support zone, with potential to rebound toward $3368–$3375 if buying pressure holds.Trade closed: target reached
Gold is likely to continue rebounding toward the $3368–$3372 zone, but if it fails to break through, it may pull back to $3358.📊 Forex | Gold | Crypto Market Insights & Signals
📰 Real-time news updates & expert analysis
📈 Daily Buy/Sell signals for investors
💡 Technical breakdowns & market outlooks
🔗 Join our free group: t.me/+DmS-dVFJMm40MDM9
📰 Real-time news updates & expert analysis
📈 Daily Buy/Sell signals for investors
💡 Technical breakdowns & market outlooks
🔗 Join our free group: t.me/+DmS-dVFJMm40MDM9
Related publications
Disclaimer
The information and publications are not meant to be, and do not constitute, financial, investment, trading, or other types of advice or recommendations supplied or endorsed by TradingView. Read more in the Terms of Use.
📊 Forex | Gold | Crypto Market Insights & Signals
📰 Real-time news updates & expert analysis
📈 Daily Buy/Sell signals for investors
💡 Technical breakdowns & market outlooks
🔗 Join our free group: t.me/+DmS-dVFJMm40MDM9
📰 Real-time news updates & expert analysis
📈 Daily Buy/Sell signals for investors
💡 Technical breakdowns & market outlooks
🔗 Join our free group: t.me/+DmS-dVFJMm40MDM9
Related publications
Disclaimer
The information and publications are not meant to be, and do not constitute, financial, investment, trading, or other types of advice or recommendations supplied or endorsed by TradingView. Read more in the Terms of Use.