Since November 15 there hasn't been a more accurate pattern on Gold (XAUUSD) offering solid buy and sell levels:

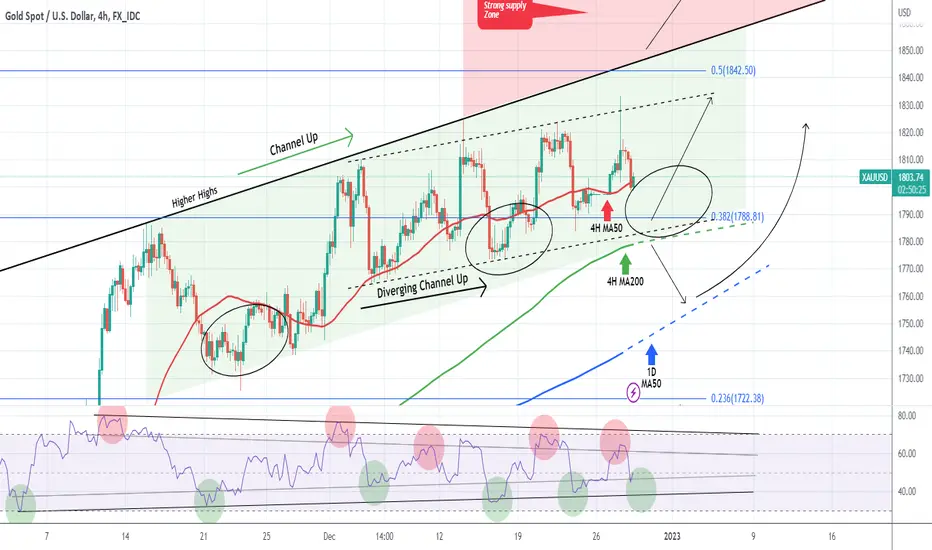
As you see, the price made two excellent technical rebounds on the bottom of the Channel Up since our last analysis and yesterday made a new Higher High. The 4H RSI Triangle pattern did its job well again and at the moment, the price marginally broke the dotted buy zone and seems to be rebounding. Even though the price can drop into the 1790 - 1785 zone before rebounding, this is a good level to start building up buy positions and target 1830.
A break and close below the 4H MA200 (green trend-line) would however turn the medium-term momentum bearish towards the 1D MA50 (blue trend-line) which is the ultimate long-term Support during uptrends.
-------------------------------------------------------------------------------
** Please LIKE 👍, SUBSCRIBE ✅, SHARE 🙌 and COMMENT ✍ if you enjoy this idea! Also share your ideas and charts in the comments section below! This is best way to keep it relevant, support me, keep the content here free and allow the idea to reach as many people as possible. **
-------------------------------------------------------------------------------
You may also TELL ME 🙋♀️🙋♂️ in the comments section which symbol you want me to analyze next and on which time-frame. The one with the most posts will be published tomorrow! 👏🎁
-------------------------------------------------------------------------------
💸💸💸💸💸💸
👇 👇 👇 👇 👇 👇
👑Best Signals (Forex/Crypto+70% accuracy) & Account Management (+20% profit/month on 10k accounts)
💰Free Channel t.me/tradingshotglobal
🤵Contact info@tradingshot.com t.me/tradingshot
🔥New service: next X100 crypto GEMS!
💰Free Channel t.me/tradingshotglobal
🤵Contact info@tradingshot.com t.me/tradingshot
🔥New service: next X100 crypto GEMS!
Disclaimer
The information and publications are not meant to be, and do not constitute, financial, investment, trading, or other types of advice or recommendations supplied or endorsed by TradingView. Read more in the Terms of Use.