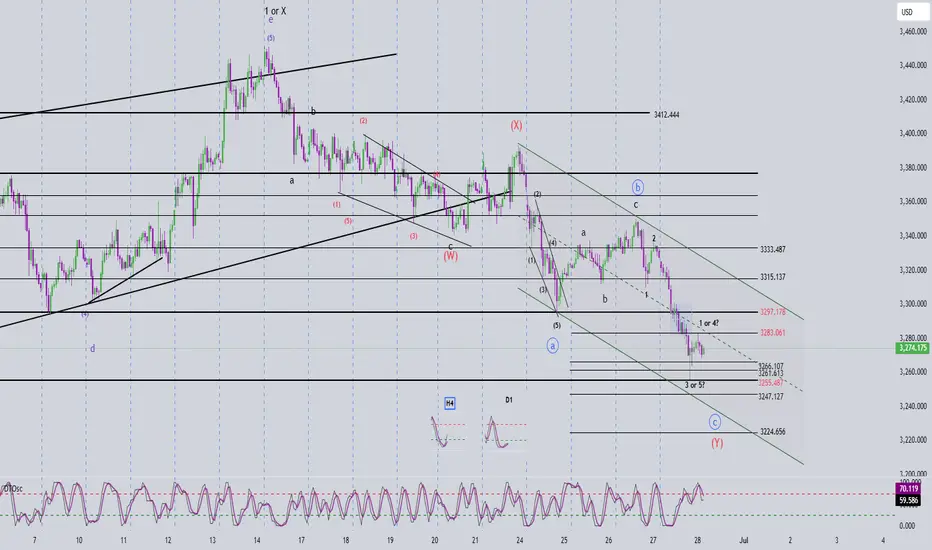
🌀 Elliott Wave Structure
On the H1 chart, we observe a double zigzag correction WXY (in red). Currently, Wave Y appears to be developing as a green abc structure.
In this abc structure:
+ Wave a started with a leading diagonal (5-wave triangle).
+ Wave b followed as a typical abc correction (in black).
+ Wave c is currently unfolding as a clear 5-wave impulsive move, characterized by sharp and rapid price action.
The key issue now is to determine whether:
+ The price has completed wave 5 (black), or
+ It has only completed wave 3 (black) within the green wave c.
If the current movement is wave 3 (black), we should expect a wave 4 correction, followed by one more leg down to complete wave 5. In this scenario, wave 5 will be confirmed if the price breaks below 3255. There are two potential target zones for wave 5:
+ Zone 1: 3247
+ Zone 2: 3224
If wave 5 has already completed, the upward move to 3283 could be wave 1 of a new bullish trend. The next pullback would be wave 2, with an expected target between 3266 – 3261.
⚡️ Momentum Analysis
D1 timeframe: Momentum is in the oversold region, suggesting a high probability of a bullish trend in the upcoming week. This supports the view that wave c (green) of wave Y (red) is nearing completion.
H4 timeframe: Momentum is turning bullish, indicating the current upward movement may continue. This adds to the uncertainty about whether wave 3 or wave 5 has ended.
🧭 Trading Plan
📍 BUY ZONE 1
Entry: 3264 – 3261
SL: 3254
TP1: 3283 | TP2: 3297 | TP3: 3315
📍 BUY ZONE 2
Entry: 3247 – 3244
SL: 3237
TP1: 3283 | TP2: 3297 | TP3: 3315
⚠️ Important Note
This trading plan assumes either wave 3 or wave 5 has completed. Therefore, if in the early Asian session, the price does not touch the 3264 – 3261 zone but instead rises above 3283 without closing above 3297, and then drops back below 3283, we should avoid buying at 3264 – 3261.
Instead, we should wait for a potential entry at the 3247 – 3244 zone.
Trade active
BUY Zone Plan: 3347 – 3344We’ve locked in +380 pips Hit TP1 in profit from this setup!
Trade closed: target reached
BUY Zone Plan: 3347 – 3344We’ve locked in +500 pips Hit TP2 in profit from this setup!
Note
📊 XAUUSD Trading Plan – Based on Elliott Wave Structure✅ Entry Conditions
🌀 Wave Structure
On the current chart, we observe a leading diagonal formation composed of 5 waves (1-2-3-4-5 in black), labeled as Wave I.
This is followed by a corrective abc pattern currently unfolding, representing Wave II.
🎯 Projected Completion Targets for Wave II
+ Target 1: 3269
+ Target 2: 3265
+ Target 3: 3258
🔄 Momentum on the H1 timeframe is showing signs of a potential bullish reversal, supporting the idea that Wave II may be nearing completion.
🧭 Trade Setup
📍 Buy Zone: 3271 – 3269
Stop Loss (SL): 3261
Take Profit (TP):
TP1: 3289
TP2: 3296
TP3: 3335
Note
🎉 Congratulations, everyone!We’ve secured a +760 pips gain from our entry at the 3247 – 3244 zone.
It’s a bit unfortunate that we couldn’t DCA at the end of Wave 2, but no worries — we’ve already achieved nearly 8R in profit, which is fantastic!
📈 Current Outlook
Price is currently moving within Wave 3, and the target around 3350 (our TP3) is highly likely.
✅ Our plan: Wait for Wave 3 to complete, then look for a buy opportunity in Wave 5 after the Wave 4 correction.
⚠️ Important Note
During Wave 3, we only trade using scalping strategies, not swing setups.
Note
🎯 TP3 Successfully Hit!We’ve officially reached TP3, which was adjusted in today’s update, for the entry at the 3247 – 3244 zone, locking in a total profit of +1000 pips with a 10R return — an outstanding result!
📉 Next Plan
We are now waiting for the Wave 4 correction to prepare a new trading plan based on the Elliott Wave cycle.
👉 Join the channel to receive more scalping signals!
Channel Telegram: t.me/+XkFQ95yHVOEwNDc1
Channel Telegram: t.me/+XkFQ95yHVOEwNDc1
Related publications
Disclaimer
The information and publications are not meant to be, and do not constitute, financial, investment, trading, or other types of advice or recommendations supplied or endorsed by TradingView. Read more in the Terms of Use.