✅ Daily Chart: The overall trend remains upward. After a continuous rally, gold hit a high near 3675 and pulled back. MA5 and MA10 are still trending upward, while MA20 around 3640 provides key support. The daily trend remains bullish but has entered a high-level consolidation phase, with resistance at 3675–3680 and support at 3615–3640.
✅ 4-Hour Chart: After forming a short-term top, gold pulled back with consecutive bearish candles and is now consolidating around 3640. MA5 and MA10 have flattened, while MA20 at 3629 acts as the key dividing line between bulls and bears. The 4-hour trend has shifted to weak consolidation. If 3629–3630 is broken, the price may further test 3610–3595.
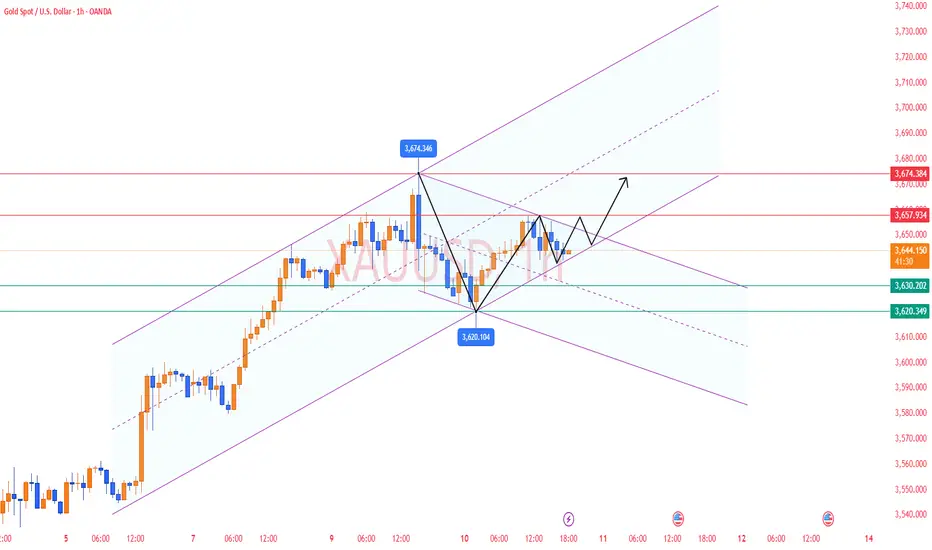
✅ 1-Hour Chart: Short-term rebounds are capped near 3650–3655, with prices fluctuating around MA5 and MA10, showing no clear direction. If the price fails to break above 3655, the short-term outlook remains range-bound to the downside.
🔴 Resistance Levels: 3650–3655 / 3675–3680
🟢 Support Levels: 3630–3635 / 3610–3595
✅ Trading Strategy Reference:
🔹 In the short term, focus on selling the rebounds. Consider short entries near 3650–3655, targeting 3630–3610, with a stop-loss above 3665.
🔹 If the price pulls back to 3630–3637 and holds, consider long entries at lower levels, targeting 3640–3650.
🔥Trading Reminder: Trading strategies are time-sensitive, and market conditions can change rapidly. Please adjust your trading plan based on real-time market conditions. If you have any questions or need one-on-one guidance, feel free to contact me🤝
✅ 4-Hour Chart: After forming a short-term top, gold pulled back with consecutive bearish candles and is now consolidating around 3640. MA5 and MA10 have flattened, while MA20 at 3629 acts as the key dividing line between bulls and bears. The 4-hour trend has shifted to weak consolidation. If 3629–3630 is broken, the price may further test 3610–3595.
✅ 1-Hour Chart: Short-term rebounds are capped near 3650–3655, with prices fluctuating around MA5 and MA10, showing no clear direction. If the price fails to break above 3655, the short-term outlook remains range-bound to the downside.
🔴 Resistance Levels: 3650–3655 / 3675–3680
🟢 Support Levels: 3630–3635 / 3610–3595
✅ Trading Strategy Reference:
🔹 In the short term, focus on selling the rebounds. Consider short entries near 3650–3655, targeting 3630–3610, with a stop-loss above 3665.
🔹 If the price pulls back to 3630–3637 and holds, consider long entries at lower levels, targeting 3640–3650.
🔥Trading Reminder: Trading strategies are time-sensitive, and market conditions can change rapidly. Please adjust your trading plan based on real-time market conditions. If you have any questions or need one-on-one guidance, feel free to contact me🤝
✅𝐃𝐚𝐢𝐥𝐲 𝟐-𝟒 𝐓𝐫𝐚𝐝𝐢𝐧𝐠 𝐒𝐢𝐠𝐧𝐚𝐥𝐬🔥
✅𝐇𝐢𝐠𝐡 𝐀𝐜𝐜𝐮𝐫𝐚𝐜𝐲 𝟗𝟎%-𝟗𝟓% 🔥
✅𝐖𝐞𝐞𝐤𝐥𝐲 𝐲𝐢𝐞𝐥𝐝 𝟔𝟎%-𝟖𝟓%🔥
👉Free Channel:t.me/+AMHhMKEIj_IzN2Vl
✉️VIP Guidance : t.me/Jack_blackwell
✅𝐇𝐢𝐠𝐡 𝐀𝐜𝐜𝐮𝐫𝐚𝐜𝐲 𝟗𝟎%-𝟗𝟓% 🔥
✅𝐖𝐞𝐞𝐤𝐥𝐲 𝐲𝐢𝐞𝐥𝐝 𝟔𝟎%-𝟖𝟓%🔥
👉Free Channel:t.me/+AMHhMKEIj_IzN2Vl
✉️VIP Guidance : t.me/Jack_blackwell
Disclaimer
The information and publications are not meant to be, and do not constitute, financial, investment, trading, or other types of advice or recommendations supplied or endorsed by TradingView. Read more in the Terms of Use.