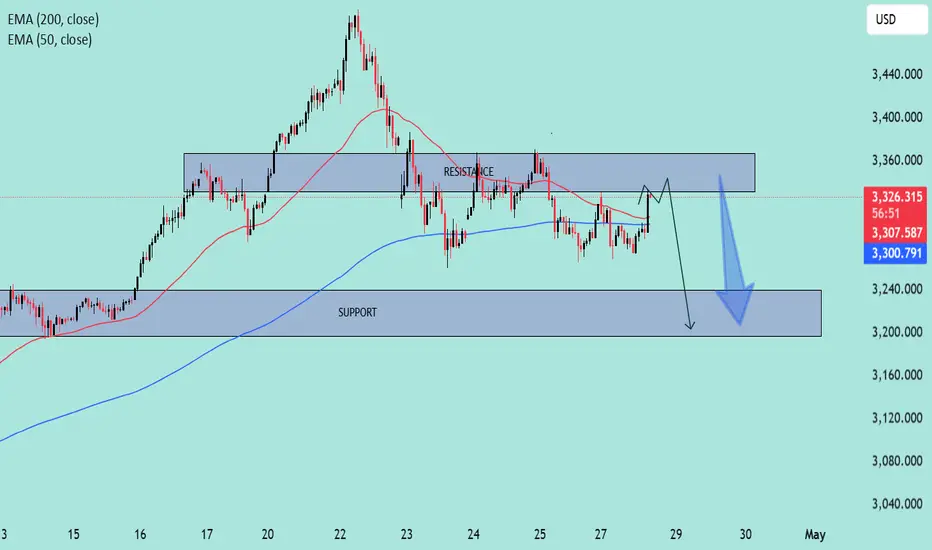
Chart Overview:
Asset: Unspecified (likely XAU/USD or an index based on price levels)
Indicators:
EMA 50 (red) — currently around 3,306.84
EMA 200 (blue) — currently around 3,300.54
Key Zones:
Resistance Zone: ~3,320 to 3,360
Support Zone: ~3,190 to 3,240
Technical Analysis:
Trend Context:
The asset previously had a strong bullish run, peaking above 3,400.
After the peak, it shifted into a lower high structure, indicating potential distribution.
Price is currently fluctuating below the resistance zone but above the support zone, suggesting range-bound conditions.
Moving Averages (EMA Analysis):
The 50 EMA is currently below the 200 EMA, signaling short-term bearish pressure.
Price is hovering around these EMAs, suggesting indecision and the possibility of a breakout or breakdown.
Resistance Behavior:
Price is projected to retest the resistance zone (~3,340–3,360) before a major drop.
The resistance zone has already acted as a strong supply area multiple times, reinforcing its significance.
Support Expectation:
After rejection from the resistance zone, price is expected to decline sharply toward the support zone (~3,200).
The drawn arrows suggest an expectation of a rapid sell-off after the final fake-out at resistance.
Structure and Price Action:
The forecasted scenario shows a liquidity grab above resistance (fake breakout) followed by a strong bearish reversal.
This is typical in a "distribution phase" where market makers induce breakout traders before reversing the move.
Summary:
Primary Bias: Bearish
Setup: Short from resistance rejection after liquidity sweep.
Target: Support zone around 3,200.
Invalidation: A clean breakout and retest above the resistance zone (~3,360) would invalidate the bearish idea.
Risk Management: Ensure proper stop loss above resistance to mitigate risk in case of a genuine breakout.
Trade active
Gold Update 🟡
Gold has pulled back from the $3,353 level to $3,300, respecting the resistance zone highlighted earlier. The current price action is developing as expected.
📌 Reminder: Always secure your trades — either by moving to break-even (BE) or placing a tight stop-loss (SL) if you're trading based on this analysis.
Protect your capital, especially when trading setups within key zones.
Trade closed: target reached
📊 Analysis Update
Gold has successfully reached the 3104 target zone 🎯, exactly as outlined in the previous chart analysis. The projected move from the resistance area to the lower support played out with precision. This reflects the power of technical confluence and disciplined market observation ✅.
💰 Profit-Taking Zone
Those who followed the idea should have secured solid profits at the 3104 support zone 💵. The reaction from this level confirms it as a key demand area. Always remember to trail your stops and lock in gains when targets are met 📈🔒.
💬 Your Thoughts & Suggestions
If you found this analysis helpful or traded along, feel free to drop your feedback, questions, or alternative views in the comments 💬👇.
Your engagement and support keep the momentum going 🙌 — let’s keep growing and learning together! 💡📘
JOIN MY TELEGRAM CHANNEL
t.me/StellarMarketAnalysis
JOIN MY RECOMMENTED BROKER REFFREL LINK
⤵️one.exnesstrack.net/a/uvd1etcgg1
PARTNER CODE⤵️
uvd1etcgg1
t.me/StellarMarketAnalysis
JOIN MY RECOMMENTED BROKER REFFREL LINK
⤵️one.exnesstrack.net/a/uvd1etcgg1
PARTNER CODE⤵️
uvd1etcgg1
Disclaimer
The information and publications are not meant to be, and do not constitute, financial, investment, trading, or other types of advice or recommendations supplied or endorsed by TradingView. Read more in the Terms of Use.