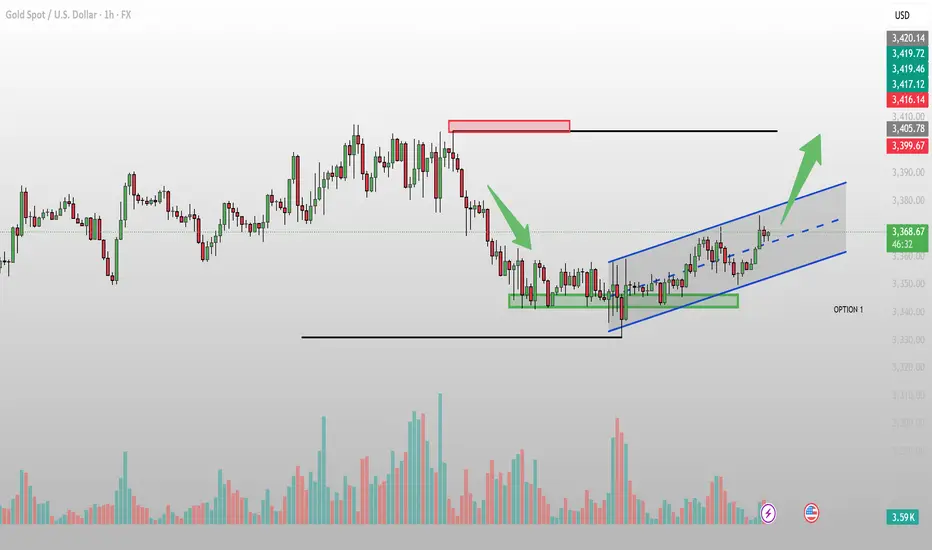
On the H1 chart, gold is moving within an ascending channel after completing a consolidation phase around the 3,340 – 3,345 USD support zone. Current price hovers near 3,368 USD, positioned in the upper half of the channel, reflecting short-term bullish control.

1. Key Technical Levels
Nearest Support: 3,355 – 3,360 USD (mid-channel, confluence with EMA support)
Major Support: 3,340 – 3,345 USD (previous consolidation low)
Immediate Resistance: 3,380 USD (upper channel boundary)
Key Resistance: 3,399 – 3,405 USD (confluence of previous highs and horizontal resistance)
2. Price Action Insights
Following the drop from 3,410 USD, price formed a double bottom around 3,340 USD and rebounded.
Trading volume is increasing as price approaches the upper channel, indicating stronger buying pressure.
Both EMA20 and EMA50 are trending upward, acting as dynamic support.
RSI remains above 50 and below overbought territory, signaling further upside potential.
3. Suggested Trading Strategies
Scenario 1 (Preferred): Buy on pullback to 3,355 – 3,360 USD, SL below 3,345 USD, short-term TP at 3,380 USD, extended TP at 3,399 – 3,405 USD.
Scenario 2: Buy on breakout above 3,380 USD with strong volume, enter after successful retest, SL below 3,370 USD, TP at 3,399 – 3,405 USD.
Risk Scenario: A break below 3,340 USD invalidates the short-term uptrend, opening the way to 3,320 USD.
Conclusion
XAUUSD maintains a clear short-term bullish structure. The 3,355 – 3,360 USD area offers a strategic buying opportunity, but traders should monitor reactions at 3,399 – 3,405 USD to avoid reversal risk. Follow for more quality trading strategies.
🪙 JOIN OUR FREE TELEGRAM GROUP 🪙
t.me/dnaprofits
Join the community group to get support and share knowledge!
️🥇 Exchange and learn market knowledge
️🥇 Support free trading signals
t.me/dnaprofits
Join the community group to get support and share knowledge!
️🥇 Exchange and learn market knowledge
️🥇 Support free trading signals
Related publications
Disclaimer
The information and publications are not meant to be, and do not constitute, financial, investment, trading, or other types of advice or recommendations supplied or endorsed by TradingView. Read more in the Terms of Use.