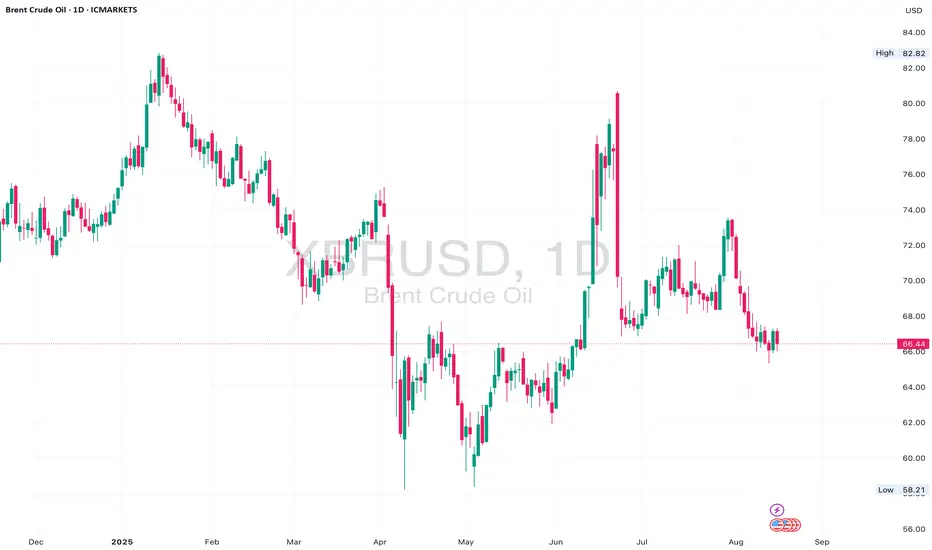
Brent Crude has been consolidating within a symmetrical triangle on the daily chart since mid-May, following a strong bullish recovery from $58 lows. Price is now approaching the apex of the structure, suggesting a breakout is imminent.
We’re still holding above the higher low trendline support, but resistance at $71.00 remains unbroken. A decisive daily candle close outside this triangle will likely set the tone for the next leg.
A bullish breakout above $71.15 could expose $75.00 and eventually $82.00 highs. But if bears take control and break below $67.00 support, $64.00 and $58.00 reopen.
📈 Bias:
Neutral short term — Waiting for breakout confirmation.
Bullish if price breaks and retests above $71.15.
Bearish if we lose $67.00 and structure fails.
Disclaimer
The information and publications are not meant to be, and do not constitute, financial, investment, trading, or other types of advice or recommendations supplied or endorsed by TradingView. Read more in the Terms of Use.
Disclaimer
The information and publications are not meant to be, and do not constitute, financial, investment, trading, or other types of advice or recommendations supplied or endorsed by TradingView. Read more in the Terms of Use.