Oil Price Surges at Monday Open Amid US Strikes on Iran
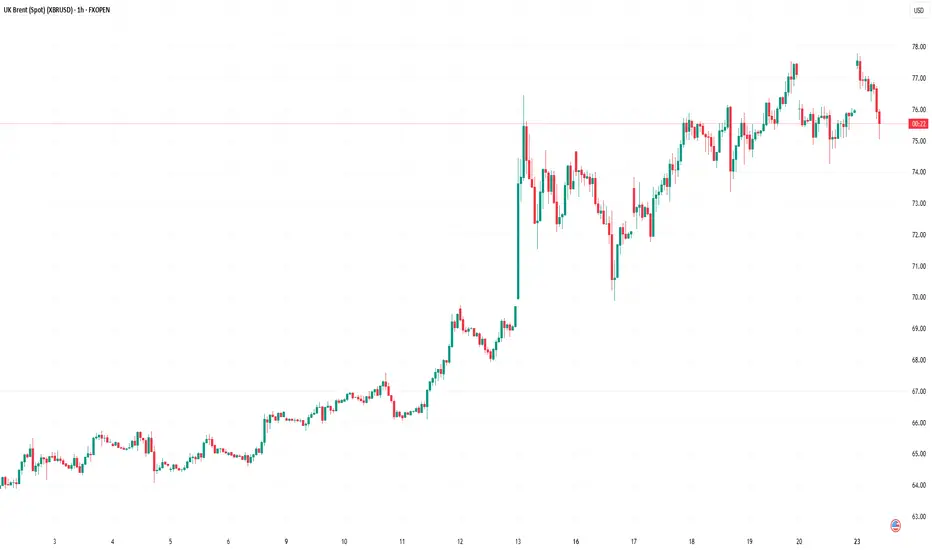
As shown on the XBR/USD chart, the Brent crude oil price formed a bullish gap at the opening of financial markets this Monday, surpassing last week’s high.
Only three days ago, we drew attention to Donald Trump’s statement that a decision regarding US involvement in the Iran-Israel conflict would be made within two weeks – yet over the weekend, US aircraft dropped bombs on Iran’s nuclear facilities.
Now oil prices are likely to be affected by Iran’s potential move to block shipping traffic through the Strait of Hormuz. According to Reuters, analysts suggest that in such a scenario, the oil price could climb to $100.

Technical Analysis of the XBR/USD Chart
The ascending channel plotted last week remains valid.
The fact that the price is pulling back (as indicated by the arrow) from the high set at the market open suggests the market had already priced in a significant risk of US involvement in the Iran-Israel military conflict.
Key points:
→ Technical support in the near term may be provided by the area where the lower boundary of the blue channel intersects with the $76 level (which acted as resistance at the end of last week).
→ Ultimately, fundamental factors and official statements will play a decisive role in oil price movements. It’s worth noting that, following the strikes on its territory, Iran is threatening retaliation against the US.
This article represents the opinion of the Companies operating under the FXOpen brand only. It is not to be construed as an offer, solicitation, or recommendation with respect to products and services provided by the Companies operating under the FXOpen brand, nor is it to be considered financial advice.
As shown on the XBR/USD chart, the Brent crude oil price formed a bullish gap at the opening of financial markets this Monday, surpassing last week’s high.
Only three days ago, we drew attention to Donald Trump’s statement that a decision regarding US involvement in the Iran-Israel conflict would be made within two weeks – yet over the weekend, US aircraft dropped bombs on Iran’s nuclear facilities.
Now oil prices are likely to be affected by Iran’s potential move to block shipping traffic through the Strait of Hormuz. According to Reuters, analysts suggest that in such a scenario, the oil price could climb to $100.
Technical Analysis of the XBR/USD Chart
The ascending channel plotted last week remains valid.
The fact that the price is pulling back (as indicated by the arrow) from the high set at the market open suggests the market had already priced in a significant risk of US involvement in the Iran-Israel military conflict.
Key points:
→ Technical support in the near term may be provided by the area where the lower boundary of the blue channel intersects with the $76 level (which acted as resistance at the end of last week).
→ Ultimately, fundamental factors and official statements will play a decisive role in oil price movements. It’s worth noting that, following the strikes on its territory, Iran is threatening retaliation against the US.
This article represents the opinion of the Companies operating under the FXOpen brand only. It is not to be construed as an offer, solicitation, or recommendation with respect to products and services provided by the Companies operating under the FXOpen brand, nor is it to be considered financial advice.
Disclaimer
The information and publications are not meant to be, and do not constitute, financial, investment, trading, or other types of advice or recommendations supplied or endorsed by TradingView. Read more in the Terms of Use.
Disclaimer
The information and publications are not meant to be, and do not constitute, financial, investment, trading, or other types of advice or recommendations supplied or endorsed by TradingView. Read more in the Terms of Use.