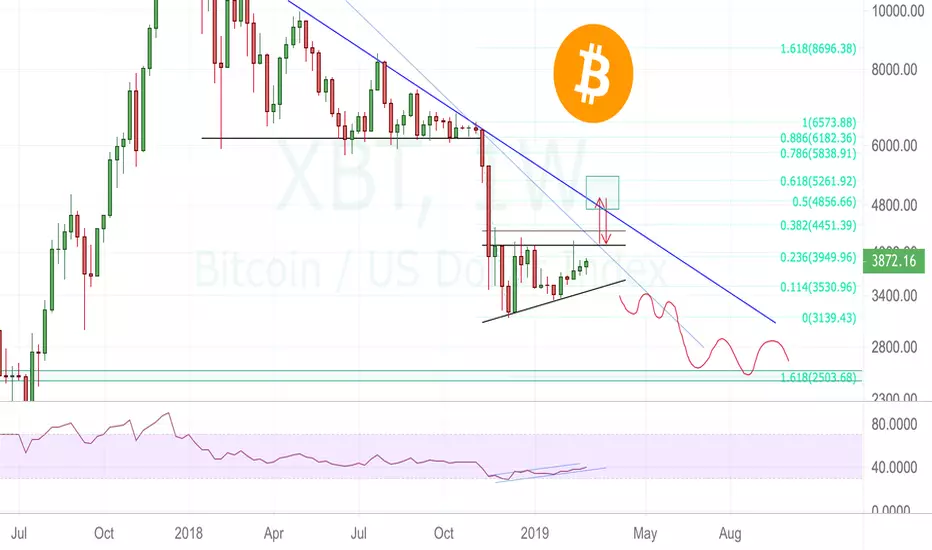
Hi there, Bitcoin chart showing some stability over the week, many people started to think that the market is recovering and it will be bullish in nearest future. Well I have doubts about it, so we calculating our probabilities to manage risks before taking trade decisions.
Look at chart now: it showing us Ascending Triangle, and price still developing inside it. So before breakout we can't take our long-term trade.
Look at Resistance lines they are Blue and formed with 2018 highs. Here we can see some short opportunities near it, approximately at 4400-4800-5200 levels (Fibonacci levels).
Indicator RSI now forming pattern similar to bear flag.
Previous important ideas:
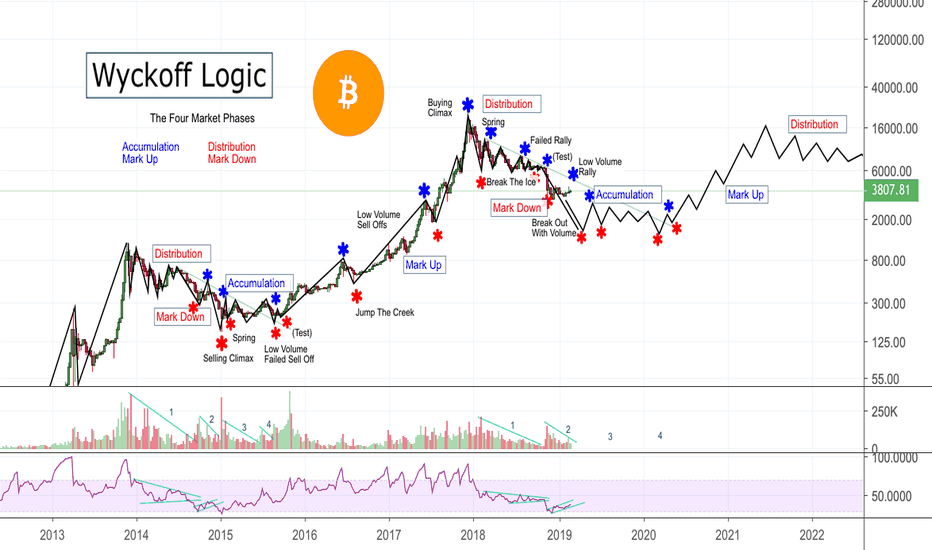
Wyckoff logic:
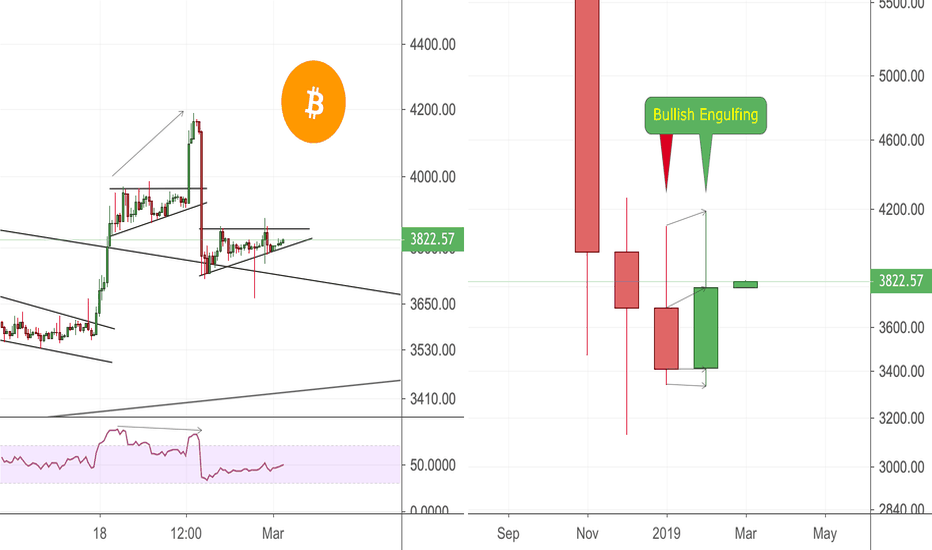
Monthly Candlesticks:
Total market cap accumulation?!

Look at chart now: it showing us Ascending Triangle, and price still developing inside it. So before breakout we can't take our long-term trade.
Look at Resistance lines they are Blue and formed with 2018 highs. Here we can see some short opportunities near it, approximately at 4400-4800-5200 levels (Fibonacci levels).
Indicator RSI now forming pattern similar to bear flag.
Previous important ideas:
Wyckoff logic:
Monthly Candlesticks:
Total market cap accumulation?!
Note
DUMP?! Always check divergences: 📲 Join Telegram Trading Community: t.me/+5hlxWmhHaKplN2Rk
🎙️ 𝘾𝙊𝙈𝙄𝙉𝙂 𝙎𝙊𝙊𝙉 Daily Live Streams on 🔴 𝗬𝗼𝘂𝗧𝘂𝗯𝗲
🔍 linktr.ee/artemcrypto ✅
🎙️ 𝘾𝙊𝙈𝙄𝙉𝙂 𝙎𝙊𝙊𝙉 Daily Live Streams on 🔴 𝗬𝗼𝘂𝗧𝘂𝗯𝗲
🔍 linktr.ee/artemcrypto ✅
Disclaimer
The information and publications are not meant to be, and do not constitute, financial, investment, trading, or other types of advice or recommendations supplied or endorsed by TradingView. Read more in the Terms of Use.
📲 Join Telegram Trading Community: t.me/+5hlxWmhHaKplN2Rk
🎙️ 𝘾𝙊𝙈𝙄𝙉𝙂 𝙎𝙊𝙊𝙉 Daily Live Streams on 🔴 𝗬𝗼𝘂𝗧𝘂𝗯𝗲
🔍 linktr.ee/artemcrypto ✅
🎙️ 𝘾𝙊𝙈𝙄𝙉𝙂 𝙎𝙊𝙊𝙉 Daily Live Streams on 🔴 𝗬𝗼𝘂𝗧𝘂𝗯𝗲
🔍 linktr.ee/artemcrypto ✅
Disclaimer
The information and publications are not meant to be, and do not constitute, financial, investment, trading, or other types of advice or recommendations supplied or endorsed by TradingView. Read more in the Terms of Use.