⋱ℌello dear friends, let's have a look at Bitcoin⋰
Structure and patterns:
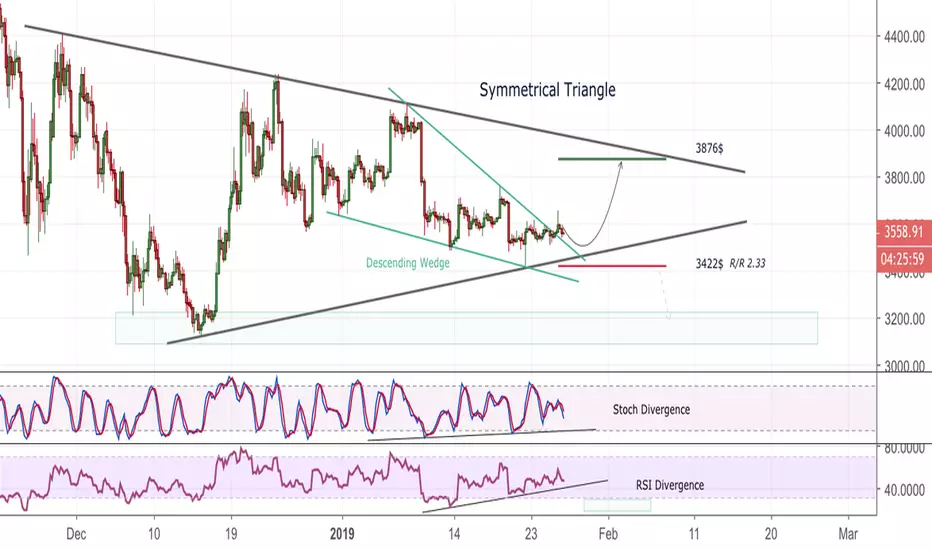
≫ Clearly we in big symmetrical triangle structure, moving inside it closely to the apex.
≫ Inside this pattern, we can found another structure called Descending Wedge (Falling Wedge), it is bullish in two of three cases so it's 67% probability to be bullish, and 33% probability to be bearish.
In this case we have a stop loss under previous swing low, at 3422$
Take profit situated at 3876$. With risk/reward ratio 2.33.
≫ Price currently broke Descending Wedge resistance.
∿ Indicators:
≫ Stochastic showing bullish divergence on 4h timeframe chart.
≫ Relative Strength Index showing bullish divergence on 4h timeframe chart.
Structure and patterns:
≫ Clearly we in big symmetrical triangle structure, moving inside it closely to the apex.
≫ Inside this pattern, we can found another structure called Descending Wedge (Falling Wedge), it is bullish in two of three cases so it's 67% probability to be bullish, and 33% probability to be bearish.
In this case we have a stop loss under previous swing low, at 3422$
Take profit situated at 3876$. With risk/reward ratio 2.33.
≫ Price currently broke Descending Wedge resistance.
∿ Indicators:
≫ Stochastic showing bullish divergence on 4h timeframe chart.
≫ Relative Strength Index showing bullish divergence on 4h timeframe chart.
Note
this chart doesn't have volume.So i decided to check it from BitMEX and look at VOLUME:
Note
looks like breakout on 1h timeframe𝗔𝗥𝗧𝗘𝗠 𝗖𝗥𝗬𝗣𝗧𝗢 | 𝗦𝗶𝗻𝗰𝗲 𝟮𝟬𝟭𝟴
📲 Join Our Telegram Trading Community: t.me/+5hlxWmhHaKplN2Rk
🎙️ Daily Live Streams on 🔴 𝗬𝗼𝘂𝗧𝘂𝗯𝗲
🔍 Explore More Resources: linktr.ee/artemcrypto ✅
📲 Join Our Telegram Trading Community: t.me/+5hlxWmhHaKplN2Rk
🎙️ Daily Live Streams on 🔴 𝗬𝗼𝘂𝗧𝘂𝗯𝗲
🔍 Explore More Resources: linktr.ee/artemcrypto ✅
Disclaimer
The information and publications are not meant to be, and do not constitute, financial, investment, trading, or other types of advice or recommendations supplied or endorsed by TradingView. Read more in the Terms of Use.
𝗔𝗥𝗧𝗘𝗠 𝗖𝗥𝗬𝗣𝗧𝗢 | 𝗦𝗶𝗻𝗰𝗲 𝟮𝟬𝟭𝟴
📲 Join Our Telegram Trading Community: t.me/+5hlxWmhHaKplN2Rk
🎙️ Daily Live Streams on 🔴 𝗬𝗼𝘂𝗧𝘂𝗯𝗲
🔍 Explore More Resources: linktr.ee/artemcrypto ✅
📲 Join Our Telegram Trading Community: t.me/+5hlxWmhHaKplN2Rk
🎙️ Daily Live Streams on 🔴 𝗬𝗼𝘂𝗧𝘂𝗯𝗲
🔍 Explore More Resources: linktr.ee/artemcrypto ✅
Disclaimer
The information and publications are not meant to be, and do not constitute, financial, investment, trading, or other types of advice or recommendations supplied or endorsed by TradingView. Read more in the Terms of Use.