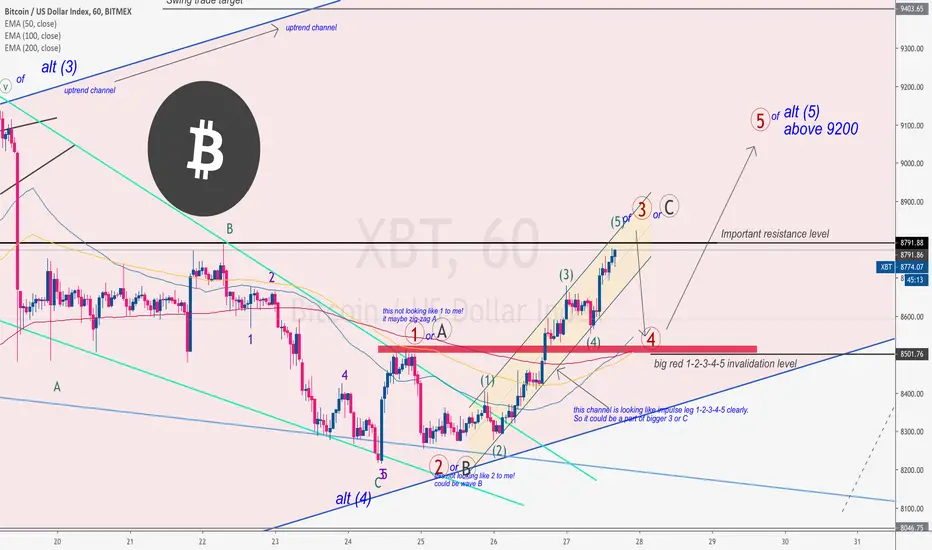
Well, last update was hit my sell target and TP-1, didn't reach T-2-3 so our profits on btc sell was screwd. Anyway it isn't easy to calculate wave pattern in between 24 and 26 January, if you figured out — send your chart please, I want to understand.
What I can see clear — current channel structure — easy impulse leg in between 26 and 28 January. So currently I expect finishing this leg and small retracement down to 8500-ish.
If price won't break red zone, I think it will continue to grow as I described in previous daily updates: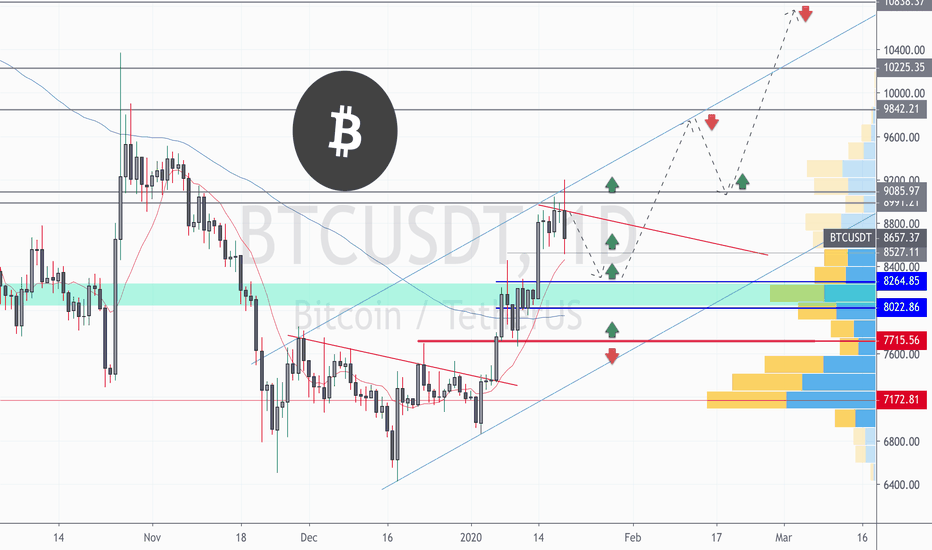
What I can see clear — current channel structure — easy impulse leg in between 26 and 28 January. So currently I expect finishing this leg and small retracement down to 8500-ish.
If price won't break red zone, I think it will continue to grow as I described in previous daily updates:
Note
So now we see end of this impulse leg, i made update to waves-placement and shall we see rebound near 8500—8600—8700 Trade closed: target reached
📲 Join Telegram Trading Community: t.me/+5hlxWmhHaKplN2Rk
🎙️ 𝘾𝙊𝙈𝙄𝙉𝙂 𝙎𝙊𝙊𝙉 Daily Live Streams on 🔴 𝗬𝗼𝘂𝗧𝘂𝗯𝗲
🔍 linktr.ee/artemcrypto ✅
🎙️ 𝘾𝙊𝙈𝙄𝙉𝙂 𝙎𝙊𝙊𝙉 Daily Live Streams on 🔴 𝗬𝗼𝘂𝗧𝘂𝗯𝗲
🔍 linktr.ee/artemcrypto ✅
Related publications
Disclaimer
The information and publications are not meant to be, and do not constitute, financial, investment, trading, or other types of advice or recommendations supplied or endorsed by TradingView. Read more in the Terms of Use.