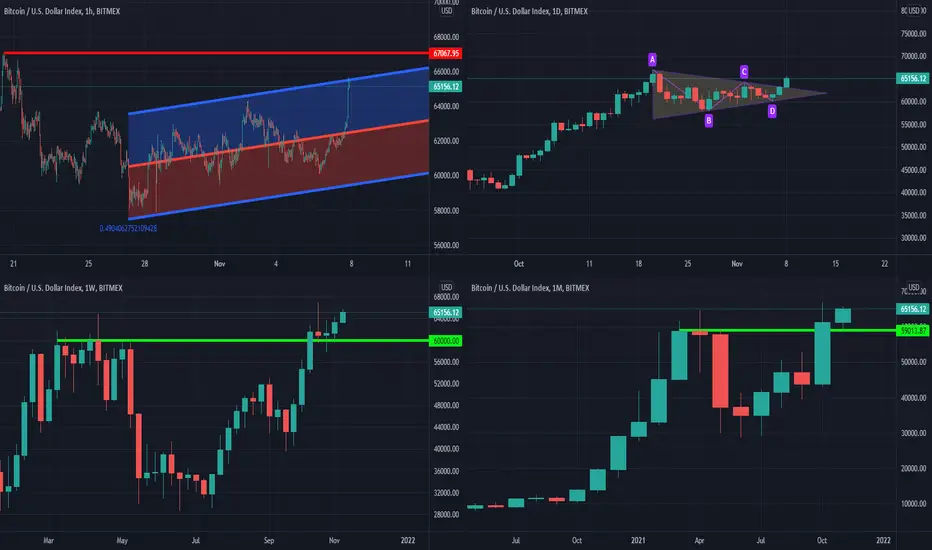
You can see the most important support (green lines) and resistance (red lines) to watch in the coming days in these charts!
Multi-Timeframe Analysis:
Hourly Chart: At the upper border of the upward regression channel (Bullish)
Daily Chart: Getting out of the triangle (Bullish)
Weekly Chart: closing constantly above 60K makes it new support!
Monthly Chart: Rebound from 59K and moving toward 67 k.
Note: what would happen if Elon Musk announces that he sold his tesla share to buy Bitcoin or another cryptocurrency?
Conclusion: I think Bitcoin has shown its power to close above 60K in the past 4 weeks!
now the question is what could be the target?
Scenario 1: Moving Toward 80K:

Scenario 2: 73-77 K

Multi-Timeframe Analysis:
Hourly Chart: At the upper border of the upward regression channel (Bullish)
Daily Chart: Getting out of the triangle (Bullish)
Weekly Chart: closing constantly above 60K makes it new support!
Monthly Chart: Rebound from 59K and moving toward 67 k.
Note: what would happen if Elon Musk announces that he sold his tesla share to buy Bitcoin or another cryptocurrency?
Conclusion: I think Bitcoin has shown its power to close above 60K in the past 4 weeks!
now the question is what could be the target?
Scenario 1: Moving Toward 80K:
Scenario 2: 73-77 K
Use the following link to access trading ideas: patreon.com/SniperTraderStocks?utm_medium=unknown&utm_source=join_link&utm_campaign=creatorshare_creator&utm_content=copyLink
Disclaimer
The information and publications are not meant to be, and do not constitute, financial, investment, trading, or other types of advice or recommendations supplied or endorsed by TradingView. Read more in the Terms of Use.