Hello?
Dear Traders, Nice to meet you.
"Like" is a great power for me.
By "following" you can always get new information quickly.
Thank you for always supporting.
--------------------------------------
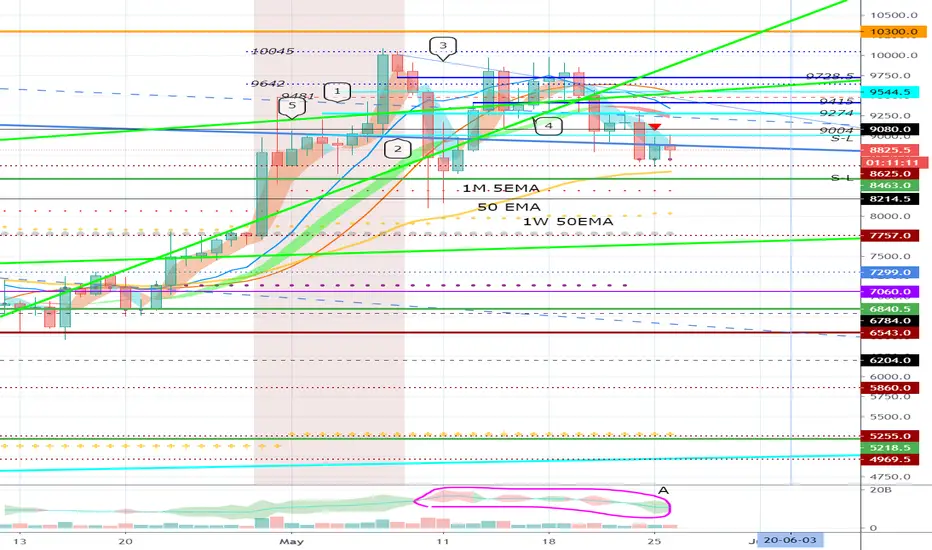
Trend line or point to be supported: Long-term downtrend line (2), 9004 points
Trend line or point where additional upside is possible: Downtrend line (1), 9274 points
Complete downtrend transition point: 8463 or less
We need to make sure we can rise above the downtrend line (2).
You should also check if it falls below 8625.
As I said in the CME Bitcoin chart, from May 27th to May 29th, there is a period of great volatility, so I think it is good to stop trading for a while and check the situation.
------------------------------------------------
** Check support, resistance and abbreviation points.
** Support or resistance is based on the closing price of the 1D chart.
** All descriptions are for reference only and do not guarantee profit or loss on investment.
Description of abbreviations shown in chart
R: A resistance point or section where a countermeasure is needed to preserve revenue.
S-L: Stop-Loss point or section
S: A point or section that can be purchased for profit generation as a support point or section
Dear Traders, Nice to meet you.
"Like" is a great power for me.
By "following" you can always get new information quickly.
Thank you for always supporting.
--------------------------------------
Trend line or point to be supported: Long-term downtrend line (2), 9004 points
Trend line or point where additional upside is possible: Downtrend line (1), 9274 points
Complete downtrend transition point: 8463 or less
We need to make sure we can rise above the downtrend line (2).
You should also check if it falls below 8625.
As I said in the CME Bitcoin chart, from May 27th to May 29th, there is a period of great volatility, so I think it is good to stop trading for a while and check the situation.
------------------------------------------------
** Check support, resistance and abbreviation points.
** Support or resistance is based on the closing price of the 1D chart.
** All descriptions are for reference only and do not guarantee profit or loss on investment.
Description of abbreviations shown in chart
R: A resistance point or section where a countermeasure is needed to preserve revenue.
S-L: Stop-Loss point or section
S: A point or section that can be purchased for profit generation as a support point or section
Note
(XBTUSD 1h chart.)If you get support in roughly 8883.5 ~ 8902, there is a possibility that you will touch the first 9080 or the second 9169.5 ~ 9225.
However, BTC volatility can be large, so be very careful with trading.
Other content (coins, stocks, etc.) is frequently posted on X.
X에 다른 내용(코인, 주식 등)이 자주 게시.
◆ t.me/readCryptoChannel
[HA-MS Indicator]
bit.ly/3YxHgvN
[OBV Indicator]
bit.ly/4dcyny3
X에 다른 내용(코인, 주식 등)이 자주 게시.
◆ t.me/readCryptoChannel
[HA-MS Indicator]
bit.ly/3YxHgvN
[OBV Indicator]
bit.ly/4dcyny3
Related publications
Disclaimer
The information and publications are not meant to be, and do not constitute, financial, investment, trading, or other types of advice or recommendations supplied or endorsed by TradingView. Read more in the Terms of Use.