Goin to be posting a few variations on this idea below.
Note
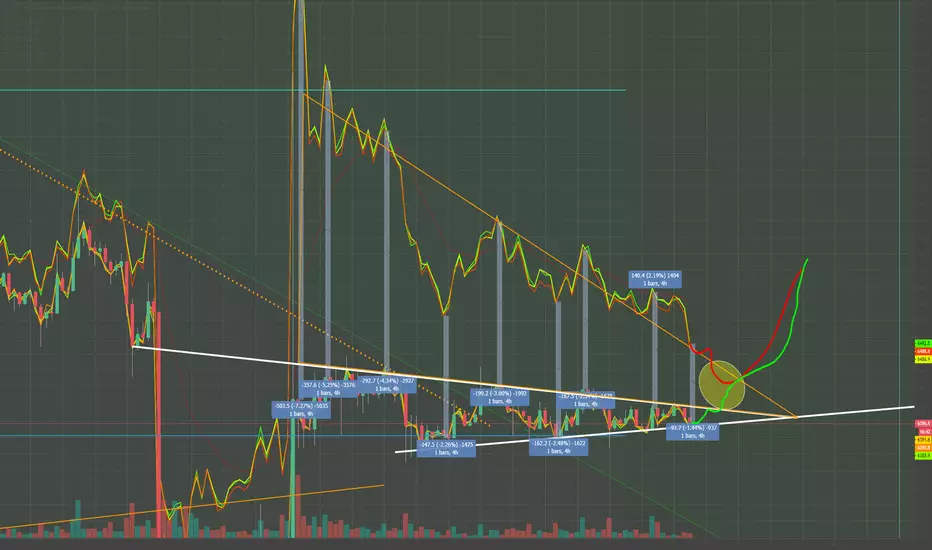
for this one I took the difference in price during each low and high and set the bottom of the Price Change box on the median (blue dashed) line of USD prices, Then took the rough average of all the peaks (circles in red) and used to form the top of this triangle. Also added the wedge BTC usd seems to be running in, and the average channel BTCUSDT seems to be falling in The meeting point could be a bit farther off than the first model
Note
On concerning thing to note is how the two pairings, BTCUSD and BTCUSDT arent heading towards each other at the same pace. USDT is falling far faster than USD is growing. this could mean a couple things, that the ONLY thing holding BTC up is tether and these arbitrage shenanigans, its possible that as soon as arbitraging is no longer possible, it'll dump hard.
On the flip side this could just be a whales accumulation wet dream, market seeling as needed on Finex, while only throwing in MASSIVE limit buy orders in mex (which ive been watching for days).
there are several other possible reason for this actually, but the fact remains that in the above chart, the two blue dashed lines are the averages since the big pump, and one is flat while the other is clearly sloping down,
any thoughts on this?
Note
And now, factoring in tethers return to 1 usd, we see if could take even a bit longer before the meeting point 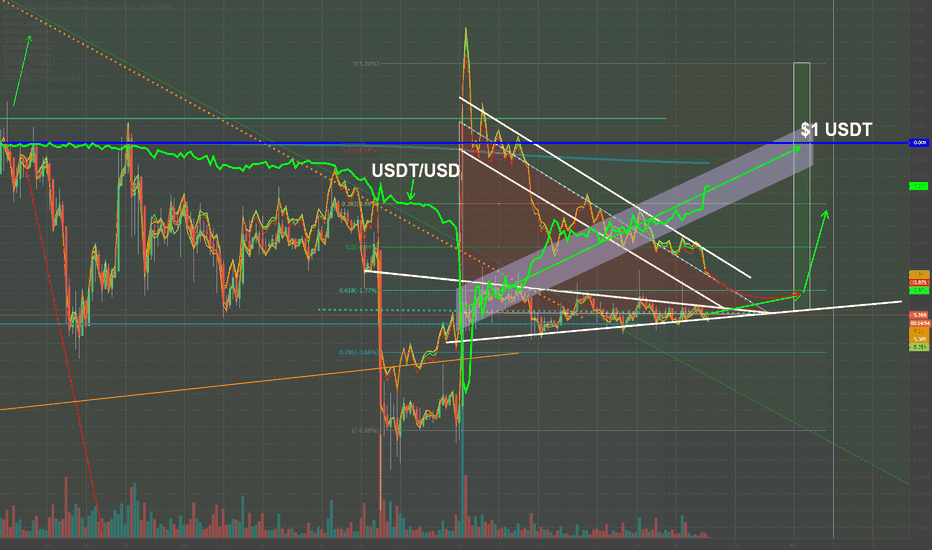
Note
Something like this could be a short term play Note
This could only happen if tether saw the jump it needs, its completely flatlined at the moment so im expecting a big move to be buildingNote
New trend support for USD pairs? Note
Tether still on track to 1 usd Disclaimer
The information and publications are not meant to be, and do not constitute, financial, investment, trading, or other types of advice or recommendations supplied or endorsed by TradingView. Read more in the Terms of Use.
Disclaimer
The information and publications are not meant to be, and do not constitute, financial, investment, trading, or other types of advice or recommendations supplied or endorsed by TradingView. Read more in the Terms of Use.