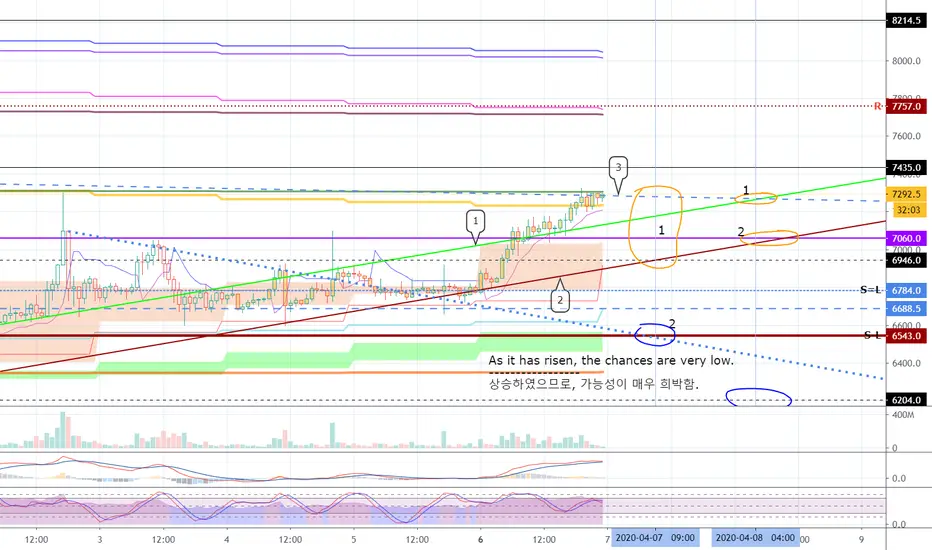
Now you need to get support at point 7060.
And, at point 6946, you have to be absolutely supportive.
BTC touched between 50EMA and 700EMA.
Also, the downtrend line (3) was touched.
The downtrend line (3) is a meaningful trend line that crosses half of the downtrend.
I think if you climb above this downtrend line (3) and get support at the 7435 point, you'd be more excited.
To do this, you need to be supported on or above the rising trend line (2) to rising trend line (1) until after 09:00 (UTC). (18:00 (UTC + 9))
The first is getting closer to the 7757 point, which is expected to show strong resistance.
Therefore, you can shake the price up and down more.
At this point, you should look closely at where you are supported.
--------------------------------------
It is time to focus on selling rather than buying to preserve profits.
For reference, the EMA shown on the chart is the EMA on the 1D chart.
----------------------------------------
Please click "Like".
If you click "Like" a lot, we will update it immediately when there are any unusual features.
Thank you.
Note
Note
Note
The short-term entry point is between 50EMA and 7299 points.
However, it is not recommended because of the high psychological burden.
Note
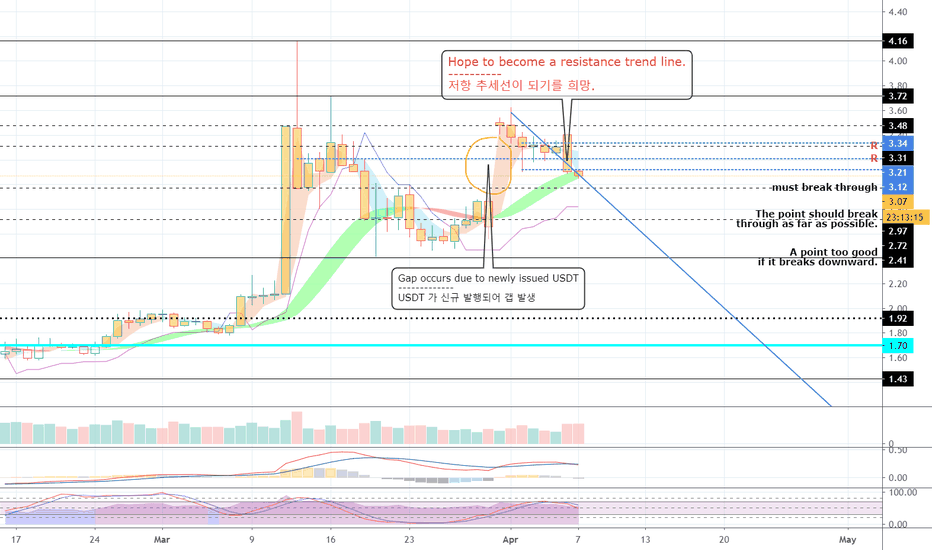
Leave everything and compare the two charts (XBTUSD, USDT.D).
However, you should also take into account that some USDT dominance flows into the Alts.
The third chart is the BTC Dominance Chart.
I think the rise and fall of the BTC Dominance Chart does not affect the BTC price, but rather the price side of the Alts.
The decline in BTC dominance could mean that more funds were going towards Alts.
Note
Last update today.
USDT dominance is showing sideways before falling below 3.0.
If you stay near the 3.12 point, it is expected to drop below 3.0.
Accordingly, the price of BTC is also expected to be flat in the 50EMA ~ 7435 range.
It can fall to a maximum of 7060 points.
Other content (coins, stocks, etc.) is frequently posted on X.
X에 다른 내용(코인, 주식 등)이 자주 게시.
◆ t.me/readCryptoChannel
[HA-MS Indicator]
bit.ly/3YxHgvN
[OBV Indicator]
bit.ly/4dcyny3
X에 다른 내용(코인, 주식 등)이 자주 게시.
◆ t.me/readCryptoChannel
[HA-MS Indicator]
bit.ly/3YxHgvN
[OBV Indicator]
bit.ly/4dcyny3
Related publications
Disclaimer
The information and publications are not meant to be, and do not constitute, financial, investment, trading, or other types of advice or recommendations supplied or endorsed by TradingView. Read more in the Terms of Use.