As described by RafaelZioni, the Red Line is an indicator that is a:
"simple script that give easy indication on the state of your asset
above the red line is bullish
below is bearish
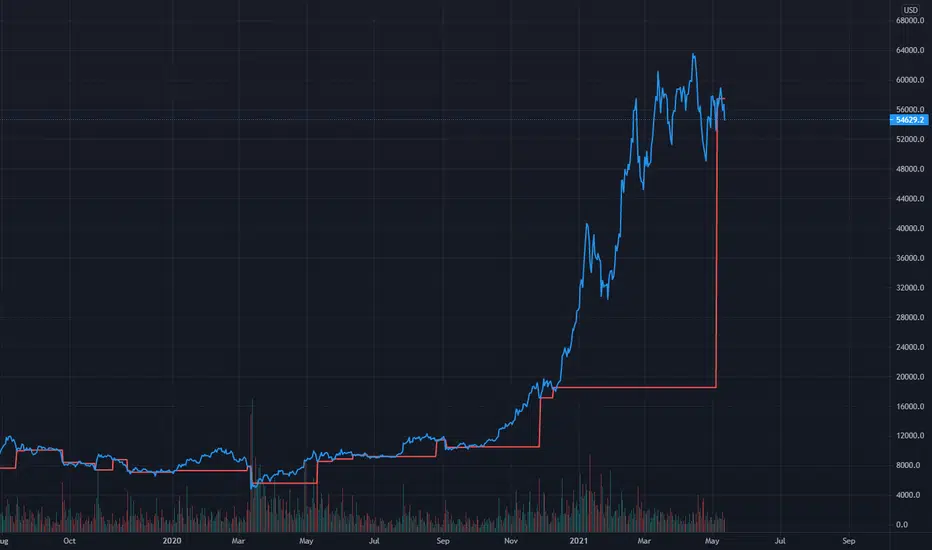
the line is based on modify level of regular pivot S3 without the MTF function"
Bitcoin is now below the Red Line on the daily chart and falling into bearish territory.
Could this be the start of bear market? Targets would be horizontal portions of past Red Line areas.
"simple script that give easy indication on the state of your asset
above the red line is bullish
below is bearish
the line is based on modify level of regular pivot S3 without the MTF function"
Bitcoin is now below the Red Line on the daily chart and falling into bearish territory.
Could this be the start of bear market? Targets would be horizontal portions of past Red Line areas.
Note
40k incomingNote
Making our way into the 3D Ichimoku cloud now. Bottom of the cloud/support currently about 35k Note
Trade closed, target reachedDisclaimer
The information and publications are not meant to be, and do not constitute, financial, investment, trading, or other types of advice or recommendations supplied or endorsed by TradingView. Read more in the Terms of Use.
Disclaimer
The information and publications are not meant to be, and do not constitute, financial, investment, trading, or other types of advice or recommendations supplied or endorsed by TradingView. Read more in the Terms of Use.