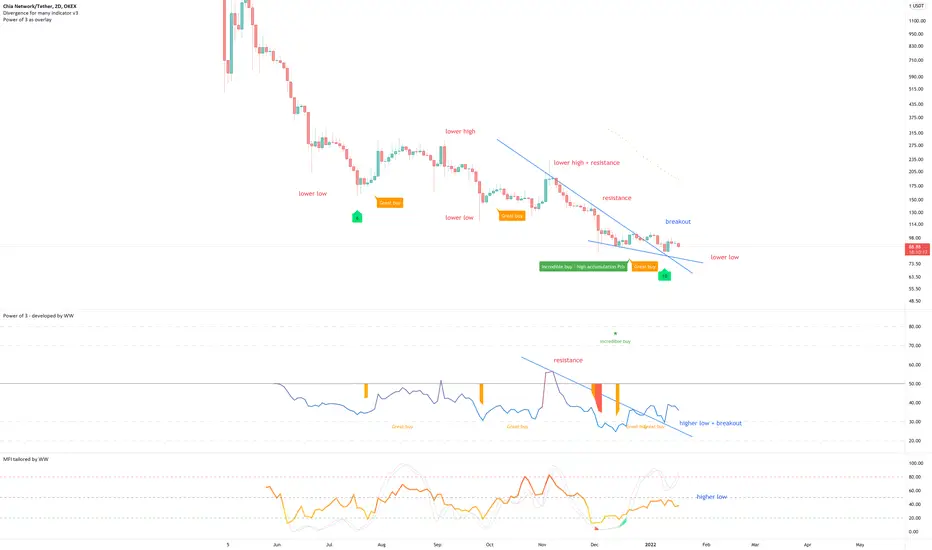
On the above 2-day chart price action has corrected a whopping 95% from $1450 in May. A number of reasons now exist to be bullish, including:
1) The ‘incredible buy’ signal prints.
2) Price action resistance and RSI resistance breaks out.
3) Bullish divergence between price action and the oscillators. Remember this is a 2-day chart. 10 oscillators are currently printing bullish divergence including MACD. Fantastic. The divergence is very clear to see on the weekly chart (below).
4) Point 1 through 3 are also applicable for the BTC pair no matter the exchange with evident volume divergence.
Is it possible price action falls further? Sure. But after 95%?!
Is it probable? No.
Good luck!
WW
Point 3 - Divergence on weekly dollar chart

Point 4 - BTC pair

1) The ‘incredible buy’ signal prints.
2) Price action resistance and RSI resistance breaks out.
3) Bullish divergence between price action and the oscillators. Remember this is a 2-day chart. 10 oscillators are currently printing bullish divergence including MACD. Fantastic. The divergence is very clear to see on the weekly chart (below).
4) Point 1 through 3 are also applicable for the BTC pair no matter the exchange with evident volume divergence.
Is it possible price action falls further? Sure. But after 95%?!
Is it probable? No.
Good luck!
WW
Point 3 - Divergence on weekly dollar chart
Point 4 - BTC pair
Trade active
On the 2-day chart price action appears to have broken out from several months of resistance.Trade active
3-day dollar chart prints Stochastic RSI crossing up 20 following 'buy' signalBTC
bc1q2eckdzh0q8vsd7swcc8et6ze7s99khhxyl7zwy
Weblink: patreon.com/withoutworries
Allow 3-6 months on ideas. Not investment advice. DYOR
bc1q2eckdzh0q8vsd7swcc8et6ze7s99khhxyl7zwy
Weblink: patreon.com/withoutworries
Allow 3-6 months on ideas. Not investment advice. DYOR
Disclaimer
The information and publications are not meant to be, and do not constitute, financial, investment, trading, or other types of advice or recommendations supplied or endorsed by TradingView. Read more in the Terms of Use.
BTC
bc1q2eckdzh0q8vsd7swcc8et6ze7s99khhxyl7zwy
Weblink: patreon.com/withoutworries
Allow 3-6 months on ideas. Not investment advice. DYOR
bc1q2eckdzh0q8vsd7swcc8et6ze7s99khhxyl7zwy
Weblink: patreon.com/withoutworries
Allow 3-6 months on ideas. Not investment advice. DYOR
Disclaimer
The information and publications are not meant to be, and do not constitute, financial, investment, trading, or other types of advice or recommendations supplied or endorsed by TradingView. Read more in the Terms of Use.