The alt-token market offers some interesting opportunities following retail capitulations. At this moment there is a handful of plays that generally exist under the $100m market capital evaluations. It is worth noting some of my best first long exposure to alt-tokens were below this market cap. That includes MATIC (idea at bottom), and Solana, and Cardano. How was this accomplished? Ta folks, the charts do not lie. Especially on higher time frames, this is the secret. Not 4hr and 15-minute charts!
Back in August of last year this token had a market cap of $7.4B, today it is $20m.
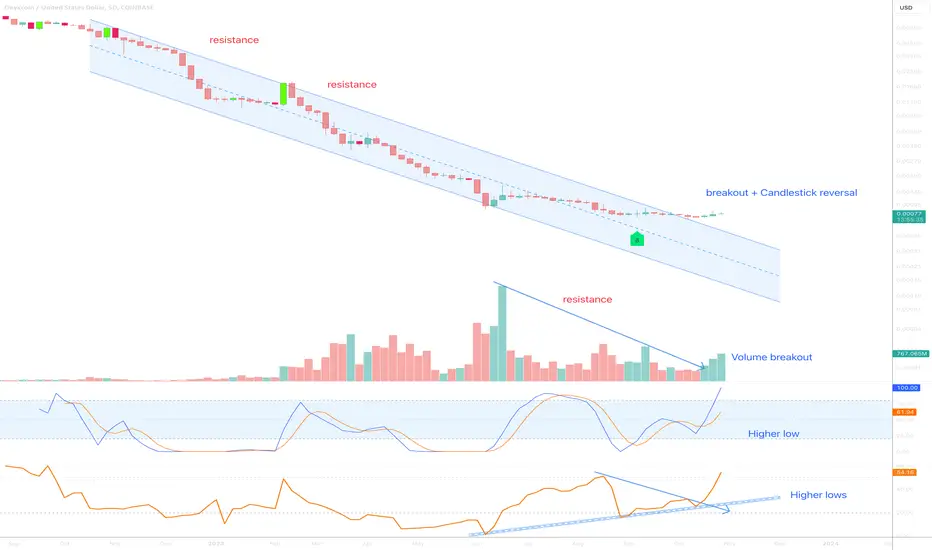
Why bullish? Volume. For whatever reason, volume is entering this market. No it is not me, I’m not a trader.
On the above 5-day chart a number of reasons now exist to be bullish. Why?
1) Price action and RSI resistance breakouts.
2) Regular bullish divergence (8 oscillators) as measured over a 3-month period.
3) Volume breakout. Money Flow Index is now printing a positive money, in other words buyers outnumber sellers.
4) Candlestick reversal pattern. Do you know this is bullish?
5) There is no suggestion or TA to be made here that forecasts market cap returns to $7.4B, however 27% of that to 22B would be your 100x.
Is it possible price action falls further? Sure.
Is it probable? No.
Ask for updates below.
Ww
Type: Trade
Risk: 1-2%
Timeframe for long: Now
Return: 100x
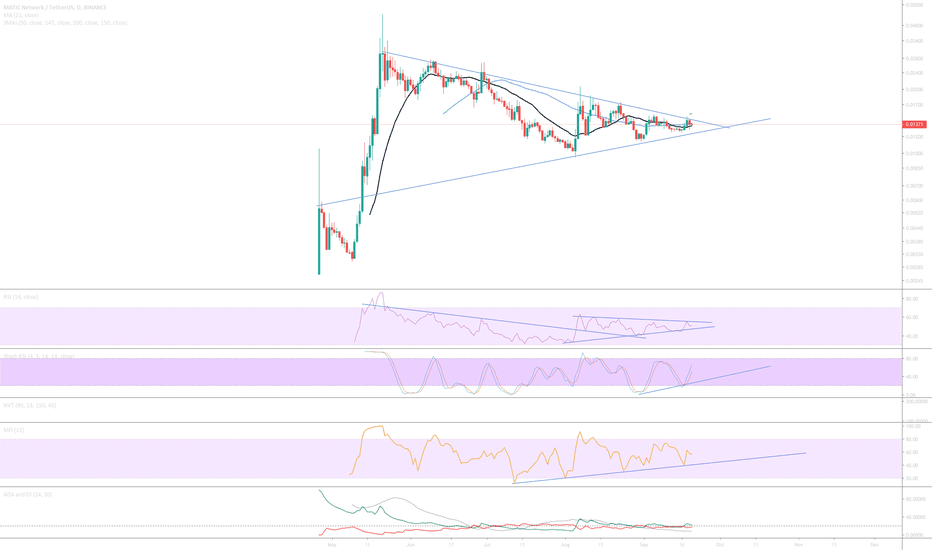
MATIC idea in September 2019 @ 1.5 cents with volume breakout
Back in August of last year this token had a market cap of $7.4B, today it is $20m.
Why bullish? Volume. For whatever reason, volume is entering this market. No it is not me, I’m not a trader.
On the above 5-day chart a number of reasons now exist to be bullish. Why?
1) Price action and RSI resistance breakouts.
2) Regular bullish divergence (8 oscillators) as measured over a 3-month period.
3) Volume breakout. Money Flow Index is now printing a positive money, in other words buyers outnumber sellers.
4) Candlestick reversal pattern. Do you know this is bullish?
5) There is no suggestion or TA to be made here that forecasts market cap returns to $7.4B, however 27% of that to 22B would be your 100x.
Is it possible price action falls further? Sure.
Is it probable? No.
Ask for updates below.
Ww
Type: Trade
Risk: 1-2%
Timeframe for long: Now
Return: 100x
MATIC idea in September 2019 @ 1.5 cents with volume breakout
Trade active
Past resistance confirms as support.Note
GRM support confirmed, multiple confirmations over the last 10 days. Don't know if that is significant but interesting.Note
Had a few questions "How can a project with no activity be so bullish?"Answer: I don't know. However I would also add, fundamentals have never had anything to do with crypto market speculation. The entire space is a Ponzi. You make profits through probability, not fundamentals.
On the daily chart a good TA example. For the first time ever this asset has confirmed support on the Gaussian channel, a fancy way of saying a trend change. There is no news to support this volume increase. If you're new to all this, learn TA!
Not in this trade, so ask for updates below. Will look at it again a year from now.
On the daily chart
Note
Past resistance already testing as support...If it confirms.. then expect a 70% move to the next resistance.
Trade active
Past resistance confirms support. Remember this is a 100x idea that should be realised sometime during the 2024 melt-up. Don't fret about the nonsense seen in the comments left on many ideas, be patient and rewards follow.Note
1x down, 99x to go.Note
"Is it time to sell" came a message. No The market is entering an alt-season, selling into momentum is about as emotional as it gets.Perhaps the idea hits over 100 likes, I'll keep it up to date.
Note
2x down, 98x to go.200% so far, 9800% to go.
Note
3x down, 97x to go!!300% in under 20 days. Alt-season, jazz hands to the bears.
Note
PS: Past resistance tested as support is a 70% correction below, don't FOMO.Trade active
Now's your chance, don't waste it.Note
Opportunities are in abundance.. Trade active
Another 200% upside move now coming up.Note
Market is becoming so technical all of a sudden. Here's a little spot the difference for you.. 3-day UMA
3-day XCN
Note
GRM support is now confirmed. Expect exciting things...
Trade active
Next resistance is 0.014 or 700% above.Note
On supportTrade active
Sellers have now returned a 45% correction since the recent highs. Don't look a gift horse in the mouth.XCN.btc pair
Trade active
A 70% correction, price action on the Fib 0.238, a high probability signal like the 2 before it since September and December, it's a good moment.Trade active
Past resistance confirms support.Note
Broken market structure on the weekly. Look for long positions after a further 30% correction.weekly
Note
Daily chart. You now know what I know ;-)Note
Since the buy signal above a the monthly chart now prints a perfect example of a Dragonfly DOJI candle.Being such a small market cap, a DOJI print like this will cause hurricane like buy pressure. Avoid trying to trade if there is a chance to realise the full 100x potential. Only a few alt tokens are printing Dragonfly DOJI candles on the monthly, XCN is one of them, with volume. I do not know why.
Note
A 250% should be expected shortly as price action now:1) Breaks from resistance
And
2) Price a double bottom on support.
Note
look for first resistance around 0.004 or 250% above breakout as shown in chart above.Note
massive bullish engulfing on past resistance for support confirmation.Hold on for the full 100x
1 week chart
Note
250% in one day, quick get in before you miss it! .
.
.
Or would that be a mistake?
Note
high probability sell signal on 9hr chart. Price action could correct 80% and remain in an uptrend.Price action has jumped up 600% since late December's buy signal.
Bulls make money.
Bears make money.
Pigs get slaughtered.
9hr
Note
Only 200% to go and the 100x target is met.Not bad.
Note
Only 70% to go for the full 100xNote
A 70x was achieved before the correction began. The red circle identifies the publication point.A new idea very similar to XCN in terms of market structure if offering similar returns in the next bullish leg.
An AI Gaming crypto... do you know which?
Will publish when I find a moment.
Note
Wave 5 underway with forecast to 10 cents. Start selling as "conditional" sell signals start to print on the 2 day timeframe.150x since publication at forecast...
BTC
bc1q2eckdzh0q8vsd7swcc8et6ze7s99khhxyl7zwy
Weblink: patreon.com/withoutworries
Allow 3-6 months on ideas. Not investment advice. DYOR
bc1q2eckdzh0q8vsd7swcc8et6ze7s99khhxyl7zwy
Weblink: patreon.com/withoutworries
Allow 3-6 months on ideas. Not investment advice. DYOR
Disclaimer
The information and publications are not meant to be, and do not constitute, financial, investment, trading, or other types of advice or recommendations supplied or endorsed by TradingView. Read more in the Terms of Use.