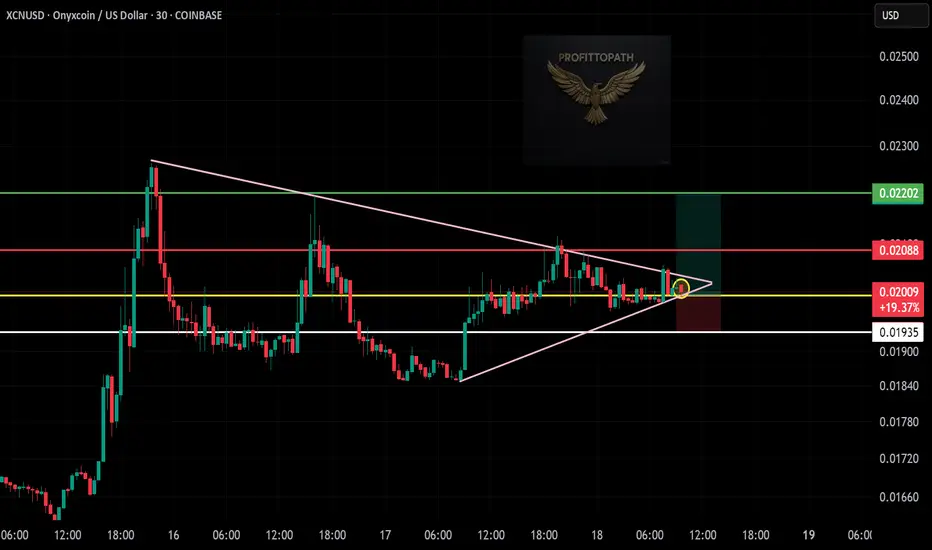
🟢 Trade Type: Long (Buy Setup)
Pair: XCN/USD (Onyxcoin vs US Dollar)
Current Price: $0.02007
Timeframe: 30-Minute Chart
🔍 Technical Setup
Pattern: Symmetrical triangle breakout (bullish bias confirmed)
Entry Point: Just after breakout (highlighted with a yellow circle)
Price Action: Clean breakout above triangle resistance + bullish candle close
Volume: Starting to rise – a good sign for momentum
🎯 Targets & SL
Take-Profit (TP):
TP1: $0.02088 (minor resistance)
TP2: $0.02202 (major resistance zone)
Stop-Loss (SL):
Below recent swing low support: $0.01935
⚖️ Risk-to-Reward (R:R)
Estimated R:R: Over 2:1, offering solid reward if breakout holds
Support Zone: Strong horizontal support at $0.01935 and rising trendline
🧠 Trade Logic
Breakout from consolidation triangle → continuation likely
Tight stop below structure → limited downside
Profit zones clearly defined with historical resistance
Disclaimer
The information and publications are not meant to be, and do not constitute, financial, investment, trading, or other types of advice or recommendations supplied or endorsed by TradingView. Read more in the Terms of Use.
Disclaimer
The information and publications are not meant to be, and do not constitute, financial, investment, trading, or other types of advice or recommendations supplied or endorsed by TradingView. Read more in the Terms of Use.