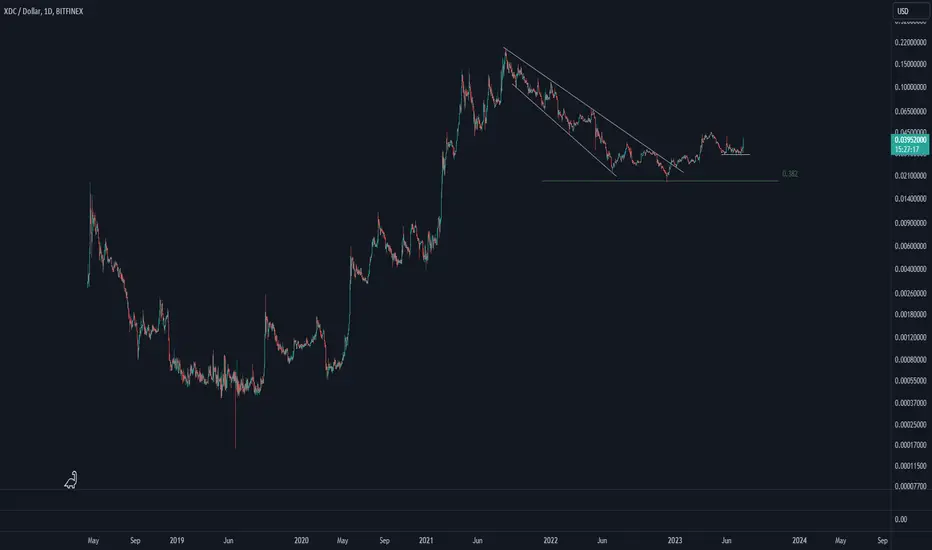
XDC Network chart is simple: a huge impulse wave followed by a corrective wave that ended at the 0.382 Fib level. Then, XDC broke the downtrend line, and an upward move started. Let's see how high XDC can go.
Note
So far, XDC reached 0.786 Fib extention level. Let's see if it can reach the 1 level.
Note
So, it seems XDC is moving in an inverted triangle pattern, and currently at the bottom of this pattern. Let's see when XDC start toward ATH.
Disclaimer
The information and publications are not meant to be, and do not constitute, financial, investment, trading, or other types of advice or recommendations supplied or endorsed by TradingView. Read more in the Terms of Use.
Disclaimer
The information and publications are not meant to be, and do not constitute, financial, investment, trading, or other types of advice or recommendations supplied or endorsed by TradingView. Read more in the Terms of Use.