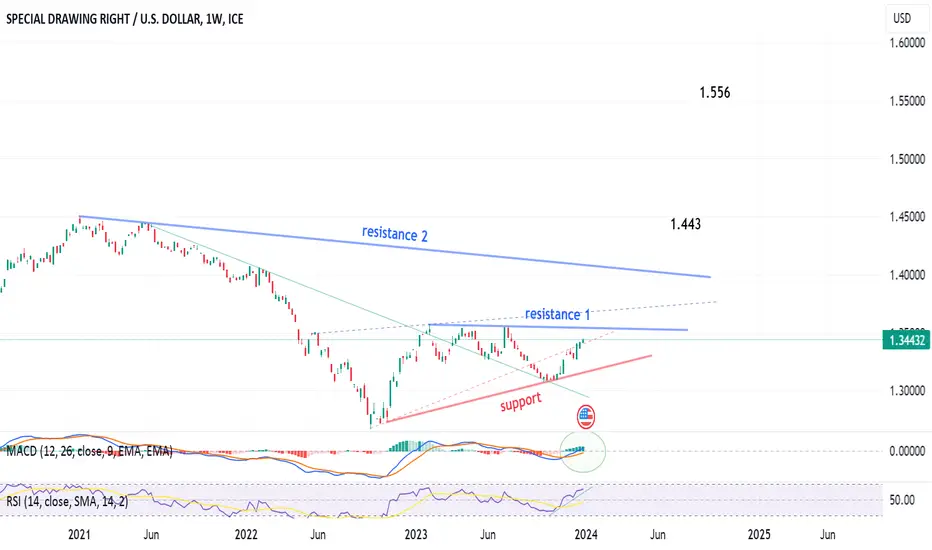
Weekly chart, the Special Drawing Right (XDR) is about to complete chart patterns V and Triangle
The targets will be 1.443 then 1.556, after crossing resistance 2 line.
Technical indicators MACD and RSI are positive. RSI is in over-bought area, which signals a near resistance.
The targets will be 1.443 then 1.556, after crossing resistance 2 line.
Technical indicators MACD and RSI are positive. RSI is in over-bought area, which signals a near resistance.
Disclaimer
The information and publications are not meant to be, and do not constitute, financial, investment, trading, or other types of advice or recommendations supplied or endorsed by TradingView. Read more in the Terms of Use.
Disclaimer
The information and publications are not meant to be, and do not constitute, financial, investment, trading, or other types of advice or recommendations supplied or endorsed by TradingView. Read more in the Terms of Use.