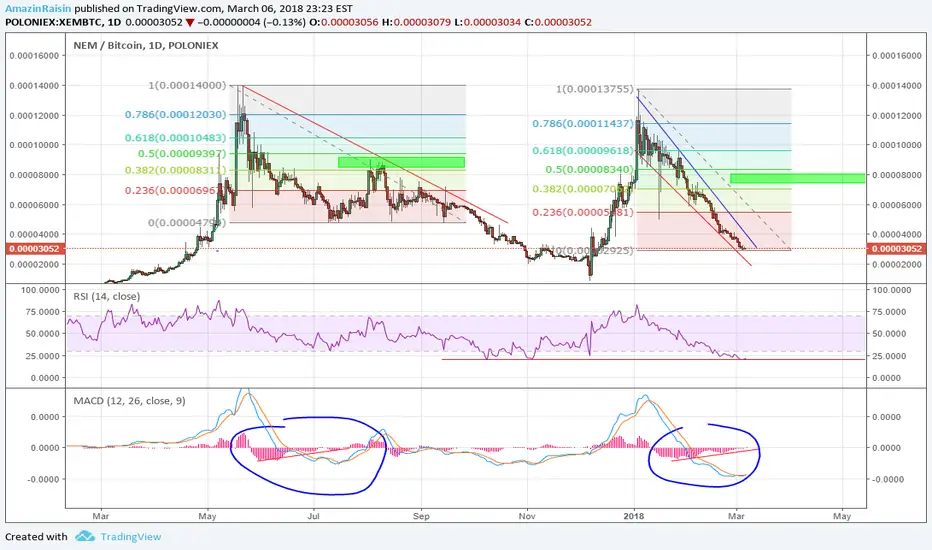
XEM has been on quite a crash as of late losing over 80% of its value from the previous run up. The RSI is looking extremely oversold on the daily chart. The MACD histogram is starting to swing up along with the lines starting to cross. It looks quite similar to the last drop with the histogram. If that happens it should get up to about the .5 FIB. To be safe TP some in between .382 and .5 FIB.
Disclaimer
The information and publications are not meant to be, and do not constitute, financial, investment, trading, or other types of advice or recommendations supplied or endorsed by TradingView. Read more in the Terms of Use.
Disclaimer
The information and publications are not meant to be, and do not constitute, financial, investment, trading, or other types of advice or recommendations supplied or endorsed by TradingView. Read more in the Terms of Use.