The currency pair remain almost unchanged in the past 24 hours. There is no trend currently on the Hourly chart as NEM is consolidating. The price is above the descending trend line.
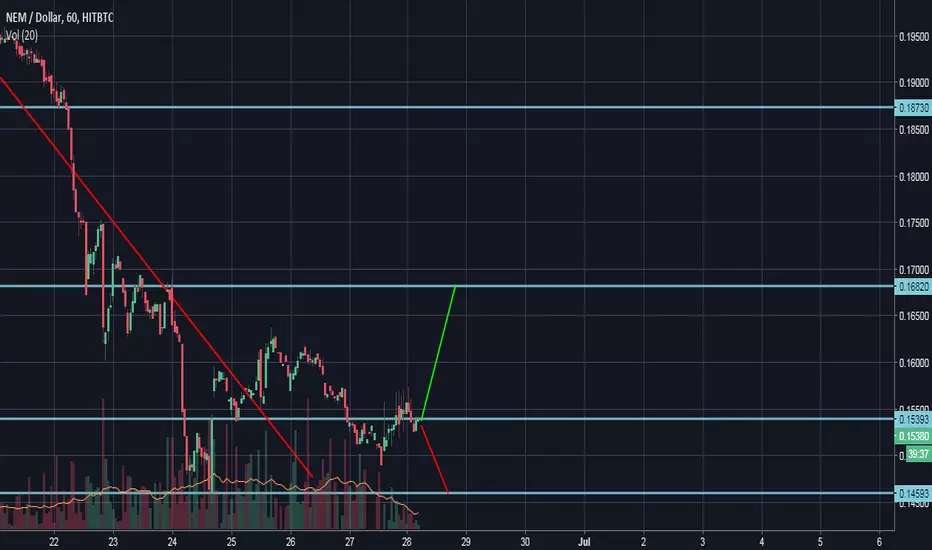
Let’s look closer at the Hourly chart and the price. NEM has tested the resistance area at $0.1539, but failed to jump over it and stays close to this level in the moment of writing. The possible ways for XEM/USD are the following:
1. Red scenario (bearish). The currency pair will decline towards the closest support area at $0.1459. We think that this is the most appropriate scenario for Thursday.
2. Green scenario (bullish). XEM/USD will jump over the resistance at $0/1539 targeting the next resistance at $0.1682.
Check the full crypto analysis HERE>>>.
Disclaimer
The information and publications are not meant to be, and do not constitute, financial, investment, trading, or other types of advice or recommendations supplied or endorsed by TradingView. Read more in the Terms of Use.
Disclaimer
The information and publications are not meant to be, and do not constitute, financial, investment, trading, or other types of advice or recommendations supplied or endorsed by TradingView. Read more in the Terms of Use.