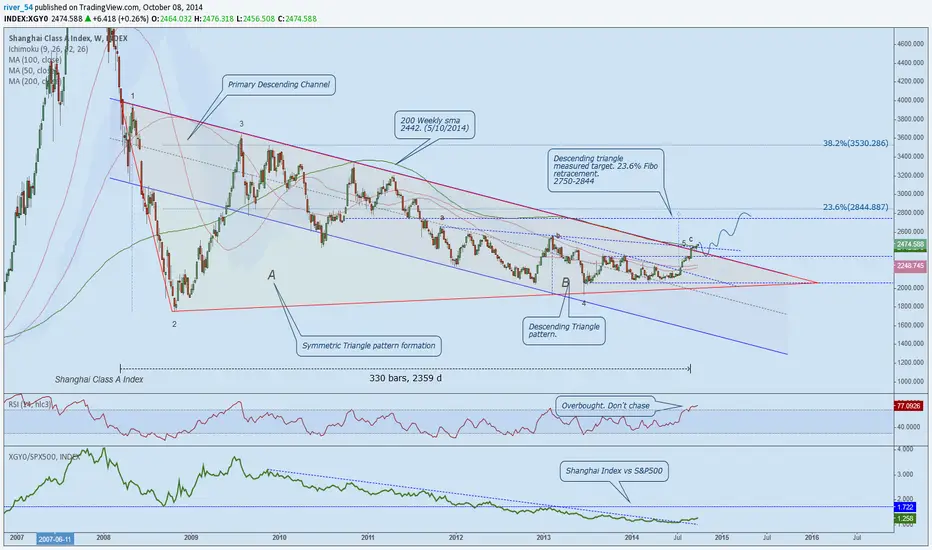
Shanghai Class A Index
Indicated Notes also on Chart.
- Price is breaking out from a descending Triangle (B)
- Breaking out from a Large Symmetrical Triangle (A)
- Just Surpassed the 200 sma ( green )
- Above the 50 and 100 sma. supports
- Breaking from a triple top abc.
- RSI overbought. Don't Chase.
- Divergence between Index-Copper.
- Index vs SPX500. Downtrend_line breaking out.
(Over_performance)
- Retest of brake_out necklines-Support.
long term Targets : 2750 - 2844
Support : 2343
Disclaimer
The information and publications are not meant to be, and do not constitute, financial, investment, trading, or other types of advice or recommendations supplied or endorsed by TradingView. Read more in the Terms of Use.
Disclaimer
The information and publications are not meant to be, and do not constitute, financial, investment, trading, or other types of advice or recommendations supplied or endorsed by TradingView. Read more in the Terms of Use.