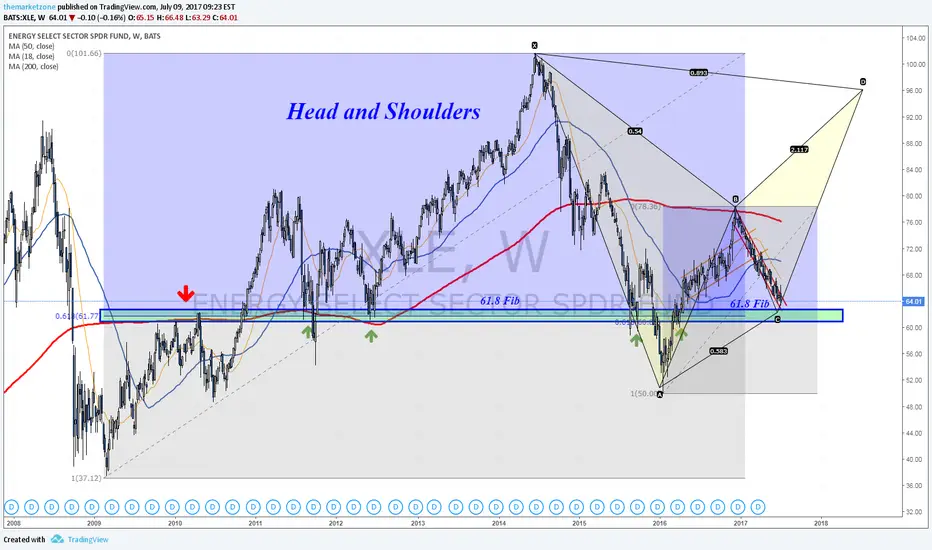
XLE is slowly making its way towards a very interesting weekly support zone - 60-62$
Notice that this price zone is the 61.8 Fibonacci level from 2009 low and from 2016.
Also notice that it is the neckline of a weekly H&S pattern.
If it will break, XLE can fall to 55$ and maybe even 50$
If it will hold as support, the extremely bullish scenario is that it will climb all the way up to complete a bearish Bat near 95$
Obviously it will have to re-test the MA lines as resistance levels first
Agree or Disagree?
It's Sunday.. you can read more about this setup and others in the newsletter
#WeeklyMarketsAnalysis (search on Twitter)
Note
The support zone in this chart will be tested this week. Last week XLE broke out of the descending channel (red) - Could be a bullish sign but the bullish move depends on OPEC
Disclaimer
The information and publications are not meant to be, and do not constitute, financial, investment, trading, or other types of advice or recommendations supplied or endorsed by TradingView. Read more in the Terms of Use.
Disclaimer
The information and publications are not meant to be, and do not constitute, financial, investment, trading, or other types of advice or recommendations supplied or endorsed by TradingView. Read more in the Terms of Use.