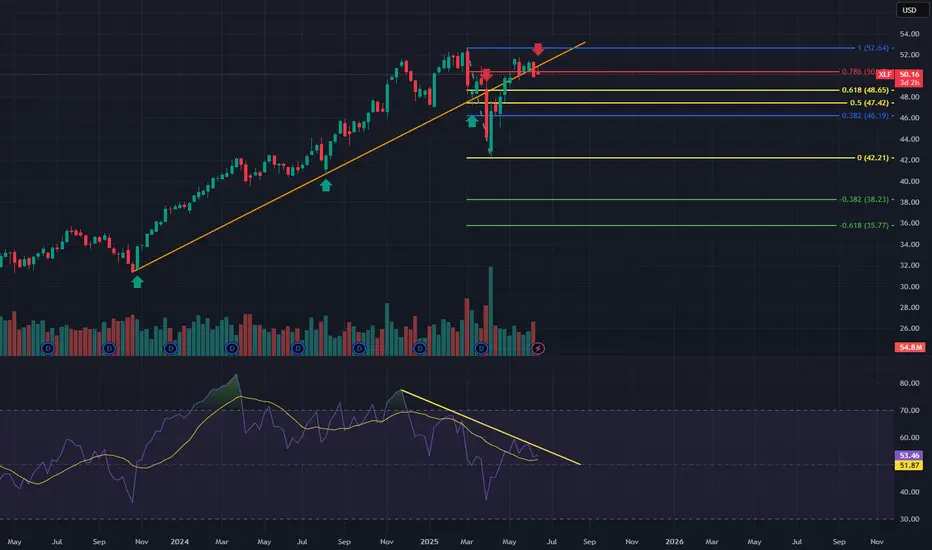
As you can see on this weekly chart, the XLF has been in this steady up trend since October 2023. It bounced off this upward slopping trendline 3 different times and then finally broke through it on the 4th hit, then came back up to test the underside of the trendline as resistance. It did get back above the trendline briefly last month, but it ended up being a bull trap as it fell back below the trendline and is now testing it as resistance once again and is currently being rejected. A Fibonacci retrace shows the 0.786 fib level also lines up with this area giving added confluence, as well as RSI divergence that I have highlighted. Massive Massive resistance in this area and so much room for potential downside. I see this trade as an extremely high probability of playing out. The options market agrees with me as well.
Disclaimer
The information and publications are not meant to be, and do not constitute, financial, investment, trading, or other types of advice or recommendations supplied or endorsed by TradingView. Read more in the Terms of Use.
Disclaimer
The information and publications are not meant to be, and do not constitute, financial, investment, trading, or other types of advice or recommendations supplied or endorsed by TradingView. Read more in the Terms of Use.