There is significant demand for analyzing Stellar.
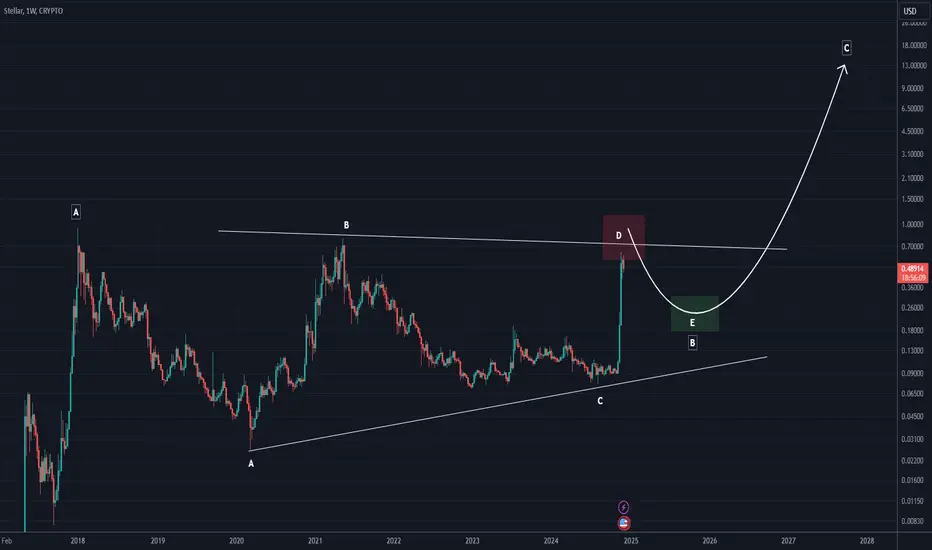
Upon examining the chart, it seems that Stellar is currently within a triangle.
Wave D will likely end around previous highs.
Afterward, we could see a correction for wave E, followed by Stellar's post-pattern movement targeting a level above $14.
Some might question whether Stellar can sustain such a market cap. We should emphasize that we rely on chart analysis and do not focus on fundamental issues, as fundamentals are reflected in the chart itself.
When we reach wave E of the triangle, if we observe a clear and identifiable pattern, we can position ourselves on Stellar for the main move.
For risk management, please don't forget stop loss and capital management
Comment if you have any questions
Thank You
🔆To succeed in trading, just enter our Telegram channel:
Free membership: t.me/Behdark_EN
🔷Our Telegram channel has daily spot and futures signals 👉 t.me/Behdark_EN
💎 Exclusive signals are only shared on our Telegram channel
Free membership: t.me/Behdark_EN
🔷Our Telegram channel has daily spot and futures signals 👉 t.me/Behdark_EN
💎 Exclusive signals are only shared on our Telegram channel
Disclaimer
The information and publications are not meant to be, and do not constitute, financial, investment, trading, or other types of advice or recommendations supplied or endorsed by TradingView. Read more in the Terms of Use.