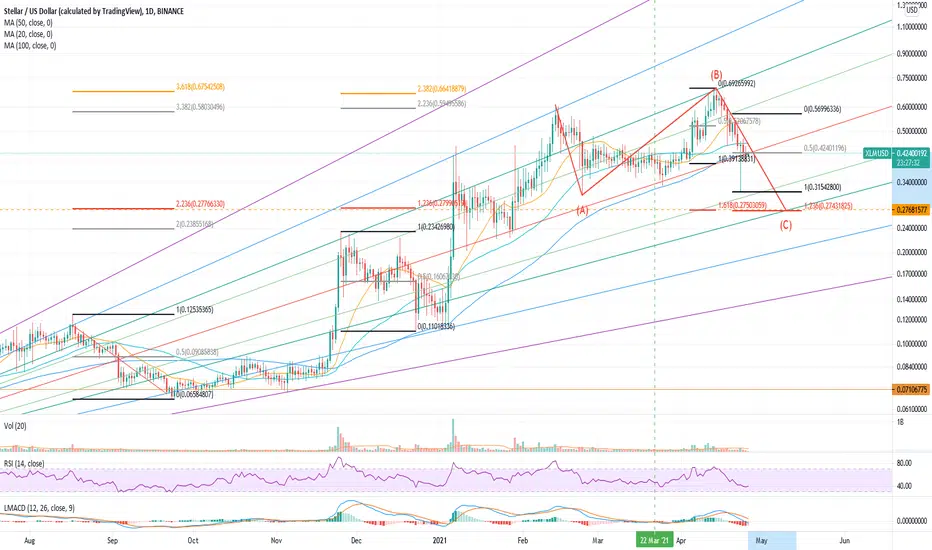
Here's my daily Logarithmic XLM Chart. What you can see is a "coincidence" of Fibonacci projections targeting the 0.276 level, a 35% correction from here (0.425).
What level will it stop at, or has it already bottomed? Let me know your thoughts in the comments.
What level will it stop at, or has it already bottomed? Let me know your thoughts in the comments.
Note
Here is the wave count for the final leg of the correction.Let's see how close it gets to the target.
Disclaimer
The information and publications are not meant to be, and do not constitute, financial, investment, trading, or other types of advice or recommendations supplied or endorsed by TradingView. Read more in the Terms of Use.
Disclaimer
The information and publications are not meant to be, and do not constitute, financial, investment, trading, or other types of advice or recommendations supplied or endorsed by TradingView. Read more in the Terms of Use.