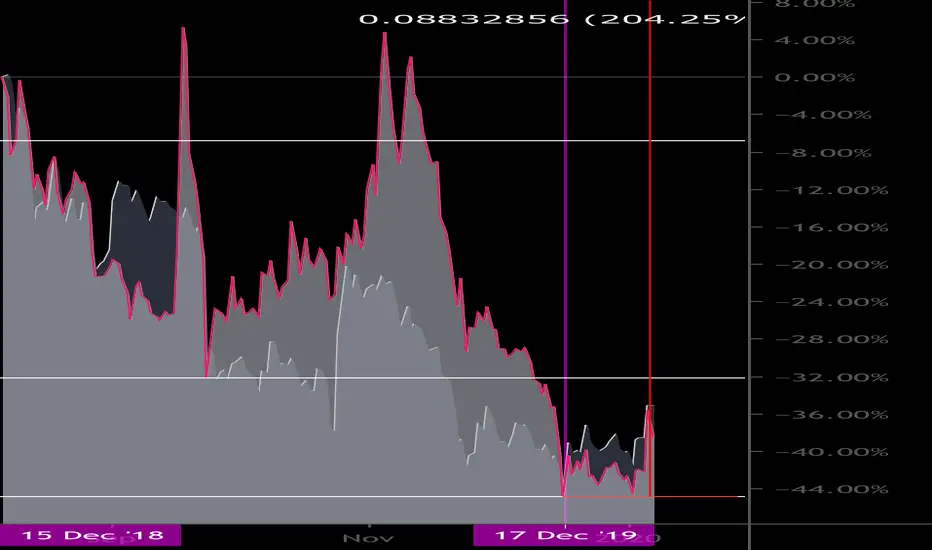
Fun chart to play around with. Xlmusd in foreground and Btcusd in background. White horizontal lines correspond to different Xlmusd accumulation phases that started in December ‘18.
Price should rise 200% from Dec ‘19 low.
Price should rise 200% from Dec ‘19 low.
Note
For those interested, probable distribution that would form CNH when completed. Would make for some great growth.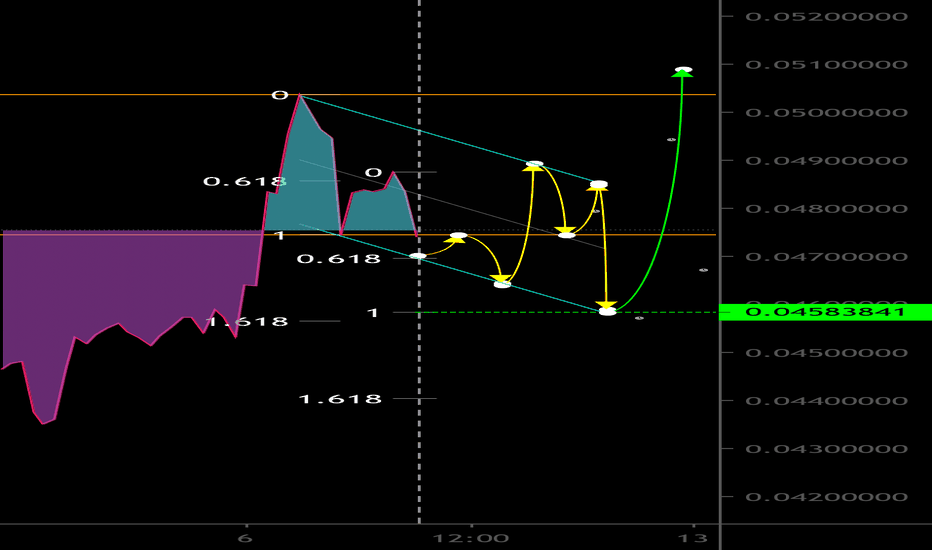
Note
Btw, I based the 200% growth on this view of the chart:Related publications
Disclaimer
The information and publications are not meant to be, and do not constitute, financial, investment, trading, or other types of advice or recommendations supplied or endorsed by TradingView. Read more in the Terms of Use.
Related publications
Disclaimer
The information and publications are not meant to be, and do not constitute, financial, investment, trading, or other types of advice or recommendations supplied or endorsed by TradingView. Read more in the Terms of Use.