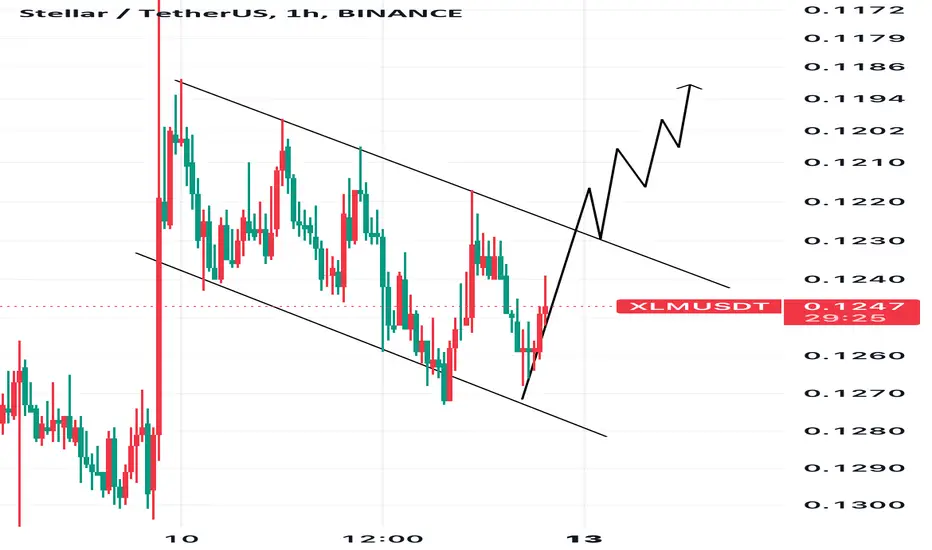
It’s a lot easier for me to look at the current market condition with an inverse chart. Inverted flag and if we break out of the flag with a retest we will see that the XLM price of 11.2 cents was not a glitch, it’s a stablished support and we might touch it once more. For that to happen the price needs to break out of the flag.
Disclaimer
The information and publications are not meant to be, and do not constitute, financial, investment, trading, or other types of advice or recommendations supplied or endorsed by TradingView. Read more in the Terms of Use.
Disclaimer
The information and publications are not meant to be, and do not constitute, financial, investment, trading, or other types of advice or recommendations supplied or endorsed by TradingView. Read more in the Terms of Use.