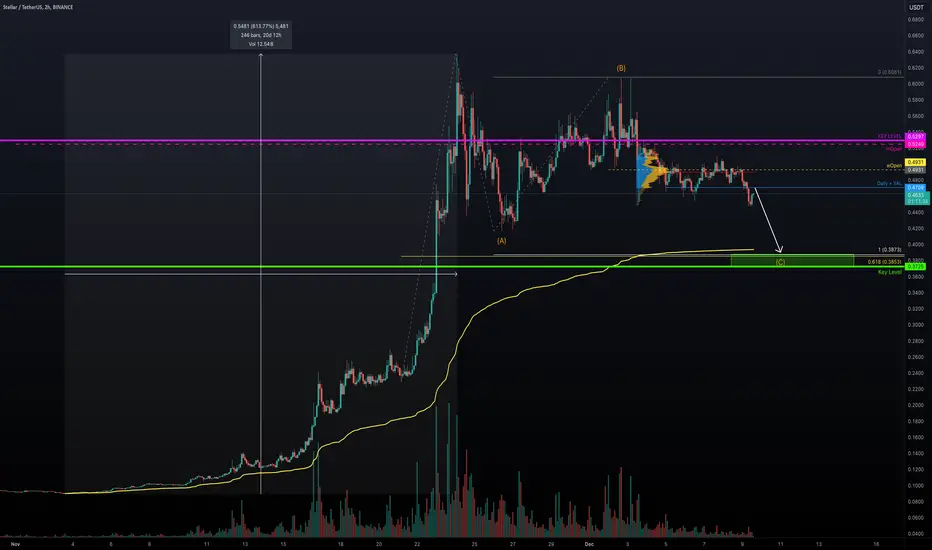
XLM had an increase of over +600% in just 20 days followed by a 15-day consolidation phase suggests an exhaustion of the previous trend. The sideways movement aligns with an ABC correction, where wave C is likely unfolding.
Key Levels and Confluence
Trend-Based Fibonacci Extensions:
1:1 Target for Wave C: $0.3873
Key Support Zone:
$0.3725−$0.3873
Market Sentiment
Lack of Volume: Reflects reduced interest from buyers, confirming a bearish bias.
Below Weekly and Monthly Opens: These levels often act as dynamic resistance, showing bears are in control for now.
🏆 Mastering Fibonacci for precision trading
🔹 Sharing high-probability trade setups
⚡ Unlock the power of technical analysis!
🔹 Sharing high-probability trade setups
⚡ Unlock the power of technical analysis!
Disclaimer
The information and publications are not meant to be, and do not constitute, financial, investment, trading, or other types of advice or recommendations supplied or endorsed by TradingView. Read more in the Terms of Use.