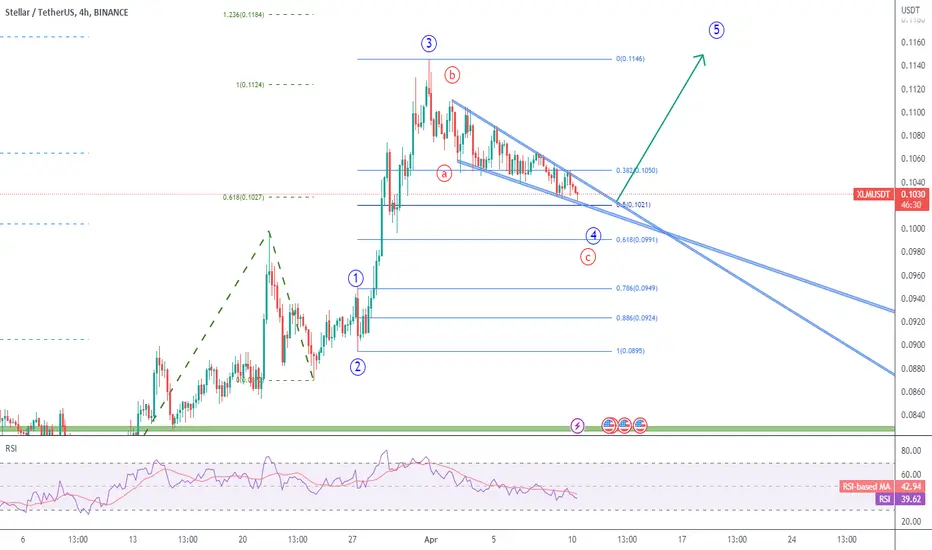
Stellar (XLM) is currently displaying a descending wedge pattern / ending diagonal, which I´m interpreting as the red wave C of the blue wave 4 correction. We could still have a test of the 50% pullback level, sitting at $0.1021, before any bullish momentum picks up.
If the descending wedge pattern is broken to the upside, we could see Stellar's price climb above the $0.1146 mark, for blue wave 5.
📈 Experienced Crypto trader
👍 Simple, actionable content
🌊 Elliott Wave junkie
🧠 Trading psychology hacks
🎖️ Premium VIP Discord Server ($4.99/mth for a limited time - check link below)
linktr.ee/stoic.trader
👍 Simple, actionable content
🌊 Elliott Wave junkie
🧠 Trading psychology hacks
🎖️ Premium VIP Discord Server ($4.99/mth for a limited time - check link below)
linktr.ee/stoic.trader
Disclaimer
The information and publications are not meant to be, and do not constitute, financial, investment, trading, or other types of advice or recommendations supplied or endorsed by TradingView. Read more in the Terms of Use.