🔍 Market Overview:
Stellar (XLM) against USDT is showing a technically significant structure. After breaking above a long-standing consolidation zone, price is now in a mild corrective phase, retesting previous resistance as new support. This setup suggests a critical decision point — will XLM confirm a bullish continuation, or was it a false breakout before further decline?
---
📌 Key Price Levels:
✅ Strong Demand Zone (Historical Support + Fibonacci Confluence)
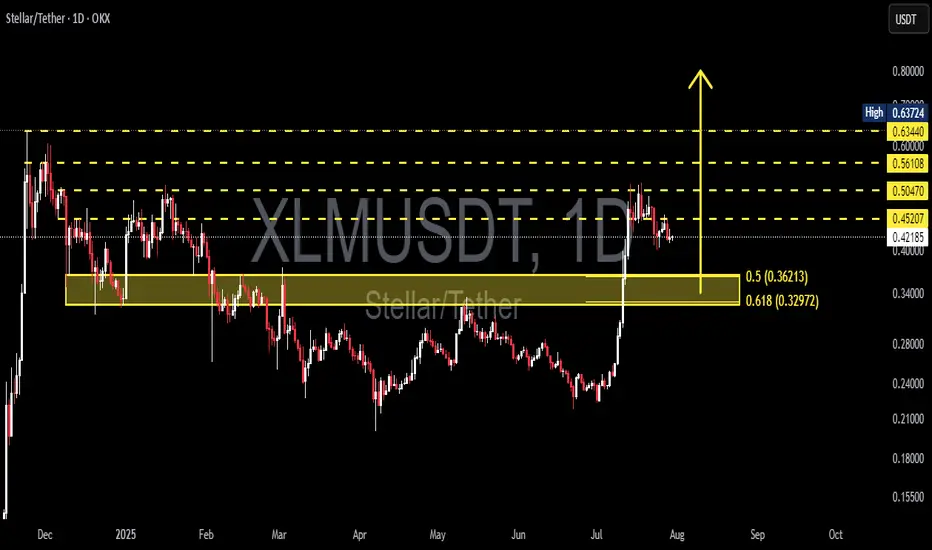
XLM recently surged from the zone between $0.32972–$0.36213, which coincides with:
Fibonacci retracement levels: 0.5 (0.36213) & 0.618 (0.32972) from the recent swing low
A multi-tested support/resistance zone, now acting as a major demand area
This zone is currently the most critical support region for bulls to defend.
❌ Layered Resistance Zones (Bullish Targets Ahead)
If upward momentum resumes, watch these key resistance levels:
0.45207 → Nearest resistance
0.50470 → Structural resistance
0.56108 → Mid-range psychological barrier
0.60000 → Historical resistance zone
0.63440 → Medium-term technical target
0.63724 → Local swing high
---
📈 Bullish Scenario:
> "As long as price holds above the demand zone without printing lower lows, the bullish bias remains valid."
1. Bullish continuation confirmed with a daily close above $0.45207, ideally supported by strong volume.
2. A bullish continuation pattern (e.g., flag or pennant) may be forming.
3. Short-term targets extend to $0.50470–$0.56108, with a mid-term outlook toward $0.63+.
4. Macro sentiment or altcoin market momentum could act as a breakout catalyst.
---
📉 Bearish Scenario:
> "A breakdown below the demand zone could trigger a bearish trend reversal."
1. Failure to hold $0.42 could trigger a deeper pullback to $0.36–$0.33 zone.
2. A confirmed breakdown below $0.32972 (Fibo 0.618) invalidates bullish structure, possibly starting a new downtrend (Lower Lows).
3. Watch for potential bearish divergence if price gets rejected around $0.45–$0.50 area.
---
📐 Chart Pattern & Market Structure:
Currently showing a developing Higher High & Higher Low (HH-HL) structure — a sign of early trend reversal.
Price may be forming a Bullish Rectangle or Ascending Triangle, depending on future break direction.
This pullback appears to be a healthy retest, not a trend reversal (yet).
---
🧠 Strategy & Trader Insights:
Swing traders may look to enter near $0.36–$0.38, with tight stops below $0.32.
Breakout traders should wait for a clear breakout and close above $0.45207 before entering.
Avoid chasing trades in the middle of the range — wait for confirmation or rejection at key levels.
---
💬 Final Thoughts:
This is a high-potential setup for XLM, provided the current support structure holds. The demand zone is acting as a critical foundation for any bullish continuation. However, risk management is essential as the market approaches a key decision point.
#XLMUSDT #Stellar #CryptoAnalysis #AltcoinSeason #PriceAction #SupportResistance #TechnicalAnalysis #FibonacciLevels #BreakoutSetup
Stellar (XLM) against USDT is showing a technically significant structure. After breaking above a long-standing consolidation zone, price is now in a mild corrective phase, retesting previous resistance as new support. This setup suggests a critical decision point — will XLM confirm a bullish continuation, or was it a false breakout before further decline?
---
📌 Key Price Levels:
✅ Strong Demand Zone (Historical Support + Fibonacci Confluence)
XLM recently surged from the zone between $0.32972–$0.36213, which coincides with:
Fibonacci retracement levels: 0.5 (0.36213) & 0.618 (0.32972) from the recent swing low
A multi-tested support/resistance zone, now acting as a major demand area
This zone is currently the most critical support region for bulls to defend.
❌ Layered Resistance Zones (Bullish Targets Ahead)
If upward momentum resumes, watch these key resistance levels:
0.45207 → Nearest resistance
0.50470 → Structural resistance
0.56108 → Mid-range psychological barrier
0.60000 → Historical resistance zone
0.63440 → Medium-term technical target
0.63724 → Local swing high
---
📈 Bullish Scenario:
> "As long as price holds above the demand zone without printing lower lows, the bullish bias remains valid."
1. Bullish continuation confirmed with a daily close above $0.45207, ideally supported by strong volume.
2. A bullish continuation pattern (e.g., flag or pennant) may be forming.
3. Short-term targets extend to $0.50470–$0.56108, with a mid-term outlook toward $0.63+.
4. Macro sentiment or altcoin market momentum could act as a breakout catalyst.
---
📉 Bearish Scenario:
> "A breakdown below the demand zone could trigger a bearish trend reversal."
1. Failure to hold $0.42 could trigger a deeper pullback to $0.36–$0.33 zone.
2. A confirmed breakdown below $0.32972 (Fibo 0.618) invalidates bullish structure, possibly starting a new downtrend (Lower Lows).
3. Watch for potential bearish divergence if price gets rejected around $0.45–$0.50 area.
---
📐 Chart Pattern & Market Structure:
Currently showing a developing Higher High & Higher Low (HH-HL) structure — a sign of early trend reversal.
Price may be forming a Bullish Rectangle or Ascending Triangle, depending on future break direction.
This pullback appears to be a healthy retest, not a trend reversal (yet).
---
🧠 Strategy & Trader Insights:
Swing traders may look to enter near $0.36–$0.38, with tight stops below $0.32.
Breakout traders should wait for a clear breakout and close above $0.45207 before entering.
Avoid chasing trades in the middle of the range — wait for confirmation or rejection at key levels.
---
💬 Final Thoughts:
This is a high-potential setup for XLM, provided the current support structure holds. The demand zone is acting as a critical foundation for any bullish continuation. However, risk management is essential as the market approaches a key decision point.
#XLMUSDT #Stellar #CryptoAnalysis #AltcoinSeason #PriceAction #SupportResistance #TechnicalAnalysis #FibonacciLevels #BreakoutSetup
✅ Get Free Signals! Join Our Telegram Channel Here: t.me/TheCryptoNuclear
✅ Twitter: twitter.com/crypto_nuclear
✅ Join Bybit : partner.bybit.com/b/nuclearvip
✅ Benefits : Lifetime Trading Fee Discount -50%
✅ Twitter: twitter.com/crypto_nuclear
✅ Join Bybit : partner.bybit.com/b/nuclearvip
✅ Benefits : Lifetime Trading Fee Discount -50%
Disclaimer
The information and publications are not meant to be, and do not constitute, financial, investment, trading, or other types of advice or recommendations supplied or endorsed by TradingView. Read more in the Terms of Use.