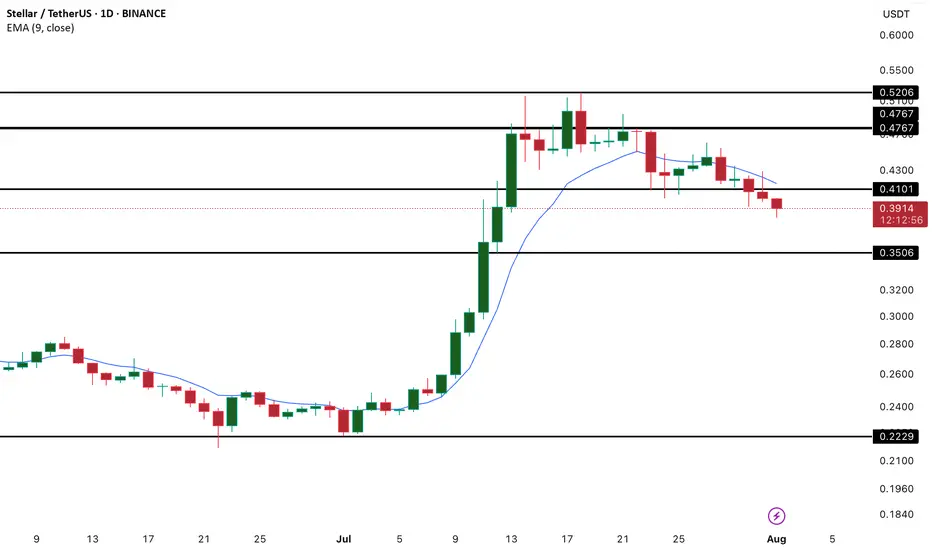
XLM has taken a notable hit, with recent price action showing a sharp drop that has dragged the token below its 20-day Exponential Moving Average (EMA). Currently sitting at $0.40, the 20-day EMA now acts as a dynamic resistance level, capping potential upside in the short term.
This development signals a clear shift in short-term sentiment. The 20-day EMA, which reflects average pricing over the last 20 sessions with an emphasis on recent moves, typically supports bullish outlooks when the price remains above it. However, XLM's break below this level suggests growing sell-side pressure and a loss of bullish control.
With momentum weakening and bearish signals intensifying, traders may want to exercise caution, especially if the price fails to reclaim the EMA in the near term. Further downside could follow if buyers don't step in to reverse the trend.
Truly Unbiased Cryptocurrency News beincrypto.com
Disclaimer
The information and publications are not meant to be, and do not constitute, financial, investment, trading, or other types of advice or recommendations supplied or endorsed by TradingView. Read more in the Terms of Use.
Truly Unbiased Cryptocurrency News beincrypto.com
Disclaimer
The information and publications are not meant to be, and do not constitute, financial, investment, trading, or other types of advice or recommendations supplied or endorsed by TradingView. Read more in the Terms of Use.