Two days ago I published a negative chart on-XME. Here is recap along with additional commentary:
In early August I was long-XME. I published an 8 year chart showing a down-trending channel.
Because I believe a new down-trend had started, I sold my position back then.
There are many sell signals.
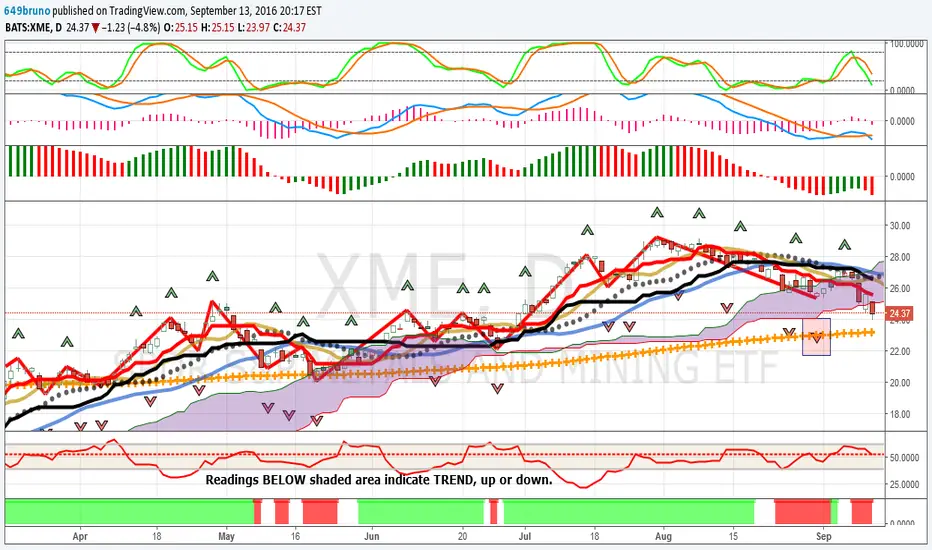
1. Sell Fractal in effect (red rectangle on chart).
2. Alligator jaws opening in tandem with sell Fractals. Now feeding in down-trend. THIS IS YOUR COMPASS.
3. Chop indicator (under chart) (indicates a trend or choppy action) is ABOVE the 38.2 shaded area, indicating a non-trending asset with a downward bias.
4. Phase energy (lower top indicator) is below zero and getting WEAKER.
5. Momentum (middle top indicator) is the 5/34 measure, and this is heading DOWN.
6. Prices are trading under the Ichimoku Cloud . THIS IS A SELL SIGNAL.
7. Prices are trading below the thick red Ichimoku Cloud conversion line. This line is heading lower. This is a sell signal.
8. Prices are trading below the Ki jun-Sen (black) baseline of the Ichimoku Cloud and this is rolling over to the down-side. This is a sell signal.
In my opinion-XME will grind its way LOWER. I say "grind" because the chop is in the shaded area.
XME-has lost almost 5% since my last published chart. just two days ago.
If CHOP heads lower during the selling (out of the shaded area), the down trend will most likely get stronger.
Good luck to you in all your trades. Don.
In early August I was long-XME. I published an 8 year chart showing a down-trending channel.
Because I believe a new down-trend had started, I sold my position back then.
There are many sell signals.
1. Sell Fractal in effect (red rectangle on chart).
2. Alligator jaws opening in tandem with sell Fractals. Now feeding in down-trend. THIS IS YOUR COMPASS.
3. Chop indicator (under chart) (indicates a trend or choppy action) is ABOVE the 38.2 shaded area, indicating a non-trending asset with a downward bias.
4. Phase energy (lower top indicator) is below zero and getting WEAKER.
5. Momentum (middle top indicator) is the 5/34 measure, and this is heading DOWN.
6. Prices are trading under the Ichimoku Cloud . THIS IS A SELL SIGNAL.
7. Prices are trading below the thick red Ichimoku Cloud conversion line. This line is heading lower. This is a sell signal.
8. Prices are trading below the Ki jun-Sen (black) baseline of the Ichimoku Cloud and this is rolling over to the down-side. This is a sell signal.
In my opinion-XME will grind its way LOWER. I say "grind" because the chop is in the shaded area.
XME-has lost almost 5% since my last published chart. just two days ago.
If CHOP heads lower during the selling (out of the shaded area), the down trend will most likely get stronger.
Good luck to you in all your trades. Don.
Related publications
Disclaimer
The information and publications are not meant to be, and do not constitute, financial, investment, trading, or other types of advice or recommendations supplied or endorsed by TradingView. Read more in the Terms of Use.
Related publications
Disclaimer
The information and publications are not meant to be, and do not constitute, financial, investment, trading, or other types of advice or recommendations supplied or endorsed by TradingView. Read more in the Terms of Use.