Monero succumbing to pressure
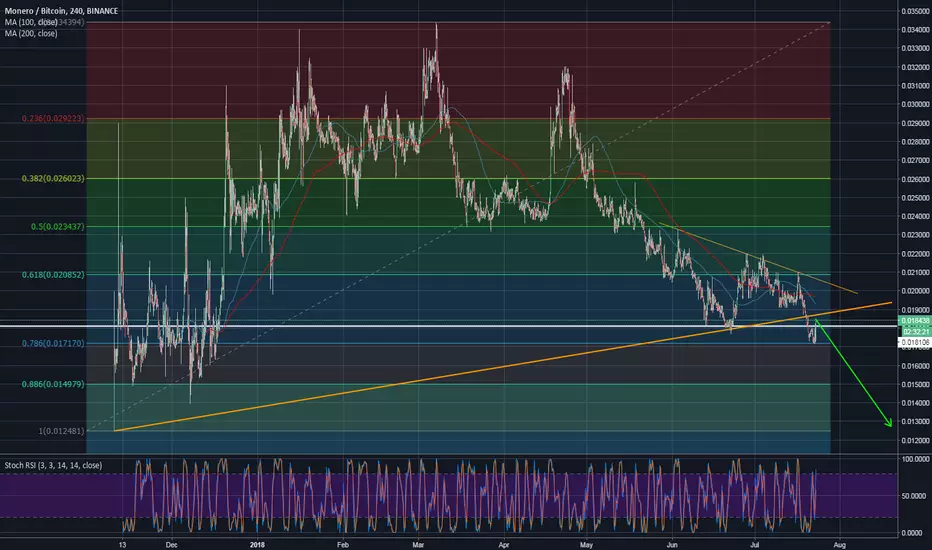
It is extremely difficult to find bullish signs in the #Monero chart on different timeframes. The coin is trading below 61.8% Fibonacci retracement, trend line support, horizontal support and both 100MA and 200 MA. It is currently bouncing off of the 78.6% retracement support and it is retesting the triangle support, now resistance, from the downside. If the price action rotates back lower from the current levels, 0.018460, then watch for the more bearish action to take place. In this case, the move through 78.6% is on the cards which will pave the way for the test of the ultimate, all-time, support around 0.01250.
If, on the other hand, the coin suddenly starts surging higher then look out for the test of the horizontal resistance around 0.01900, closely followed with the trend line resistance around 0.0200.
If, on the other hand, the coin suddenly starts surging higher then look out for the test of the horizontal resistance around 0.01900, closely followed with the trend line resistance around 0.0200.
Disclaimer
The information and publications are not meant to be, and do not constitute, financial, investment, trading, or other types of advice or recommendations supplied or endorsed by TradingView. Read more in the Terms of Use.
Disclaimer
The information and publications are not meant to be, and do not constitute, financial, investment, trading, or other types of advice or recommendations supplied or endorsed by TradingView. Read more in the Terms of Use.