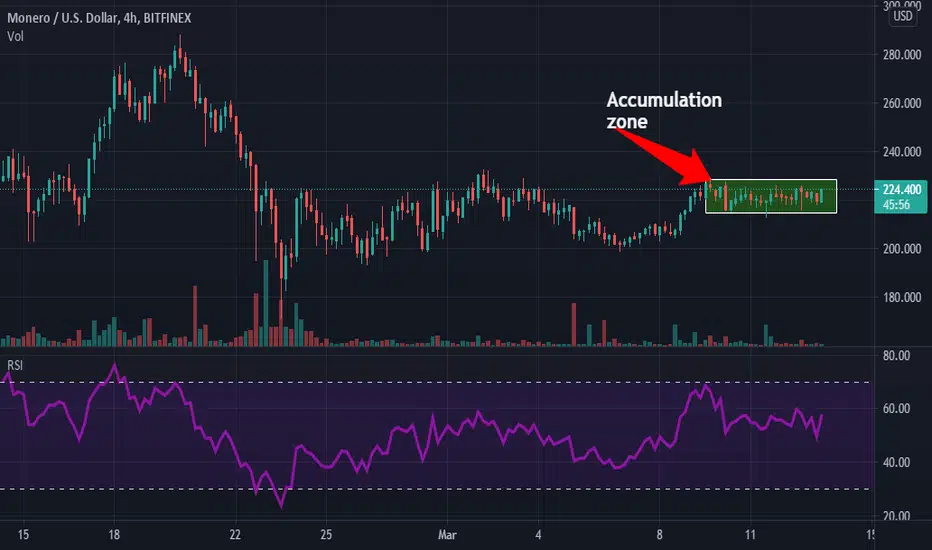
The daily chart of XMR hints at the start of a bullish move. On coming to the shorter time frame of 4 hours, the coin has formed a accumulation zone. If the price breaks above 5% of the current position, it can see a rally upto $260 in upcoming trading sessions. TRX price can also see a new low if it comes below the zone.The coin price has seen a drop of 30% after hitting the 52week high on FEB 20,2021
The volume indicator is at 2.28K with the hint of lower buying pressure. If the price climbs above $250, then a strong buying volume can be seen.
Kindly comment your thoughts below
The volume indicator is at 2.28K with the hint of lower buying pressure. If the price climbs above $250, then a strong buying volume can be seen.
Kindly comment your thoughts below
Related publications
Disclaimer
The information and publications are not meant to be, and do not constitute, financial, investment, trading, or other types of advice or recommendations supplied or endorsed by TradingView. Read more in the Terms of Use.
Related publications
Disclaimer
The information and publications are not meant to be, and do not constitute, financial, investment, trading, or other types of advice or recommendations supplied or endorsed by TradingView. Read more in the Terms of Use.