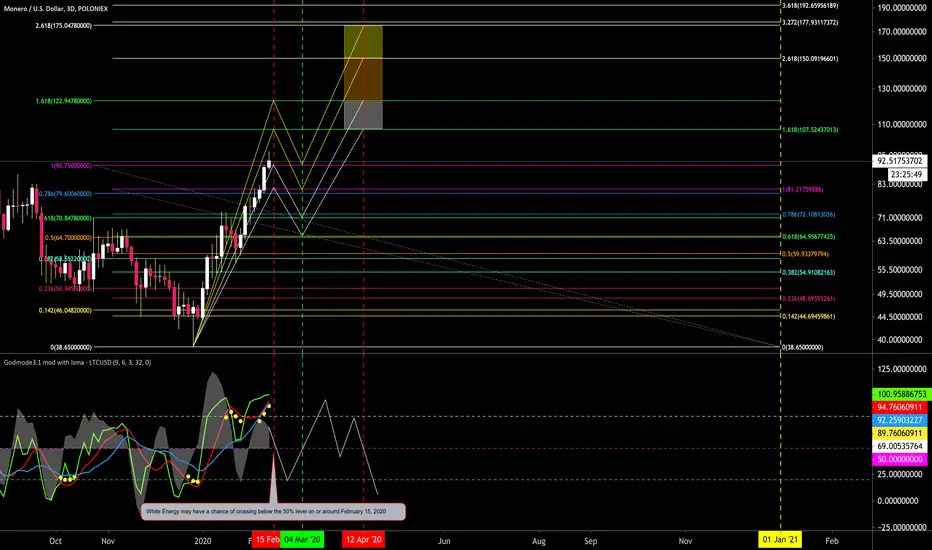
Looks like we have a chance of the White Energy crossing below the 50% level on or around February 15, 2020. Could begin February 14th or possibly February 16th. The reason I'm labeling this a LONG position is for the LONG TERM Upward Pressure I'm seeing in time frames higher than this 3-Day TF. So, do not assume I'm implying to get in this very moment. You're better off waiting for a likely upcoming dip. I'm still saying $107 to $123 at a MINIMUM but would not be surprised if we got close to $150 at the 2.618 FIB extension by first or second week of April. My Red Vertical Time Line at April 12, 2020 is "tentative" (an estimate) and subject to change as that date approaches based on what the indicators reveal as we approach April 12, 2020. I'm including a screenshot (below) of the cover chart in case TradingView's platform scrunches up the cover chart too much.

Note
Here's the 12-Day to let you see the indicators are providing an estimate of upward pressure to continue for the LONG TERM until the 12-Day Candle beginning April 6, 2020. This is subject to change in time.Related publications
Disclaimer
The information and publications are not meant to be, and do not constitute, financial, investment, trading, or other types of advice or recommendations supplied or endorsed by TradingView. Read more in the Terms of Use.
Related publications
Disclaimer
The information and publications are not meant to be, and do not constitute, financial, investment, trading, or other types of advice or recommendations supplied or endorsed by TradingView. Read more in the Terms of Use.