Updated
$XMR Finally Breaking out of 140 Day Channel?
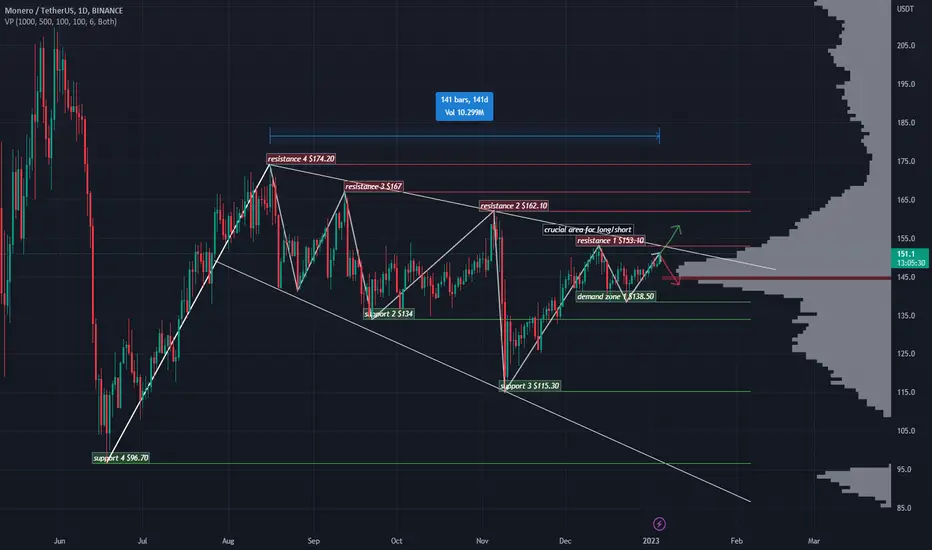
12 Jun 2022: Price Dropped Down To $96.70
16 Aug 2022: Price Rose To $174.2 (+80% Increase in 2 Months)
Since 16 Aug 2022, we have been in this specific downtrend channel.
Closing the weekly candle above $153.10 would signify a new previous high and/or possible reversal.
Possible Resistance/Support Zones #1-4 Drawn Out. Higher # Zone = Higher Probability/Strength for Possible Resistance/Support due to overextension in price.
Note
Broke Thru Resistance 1, Looking to break R2 at $162.10Note
Broke Thru Resistance 2 and 3, Looking to Break R4 at $174.20Note
Nice.Trade closed: target reached
Up +23% from Post. Congrats if you took this trade.Note
Join my Exclusive Telegram Group! t.me/+__-c5qLiLa44MjlkJoin Smarter Traders 🧠 discord.gg/t8vkMapQ3m
Disclaimer
The information and publications are not meant to be, and do not constitute, financial, investment, trading, or other types of advice or recommendations supplied or endorsed by TradingView. Read more in the Terms of Use.
Join Smarter Traders 🧠 discord.gg/t8vkMapQ3m
Disclaimer
The information and publications are not meant to be, and do not constitute, financial, investment, trading, or other types of advice or recommendations supplied or endorsed by TradingView. Read more in the Terms of Use.