📉
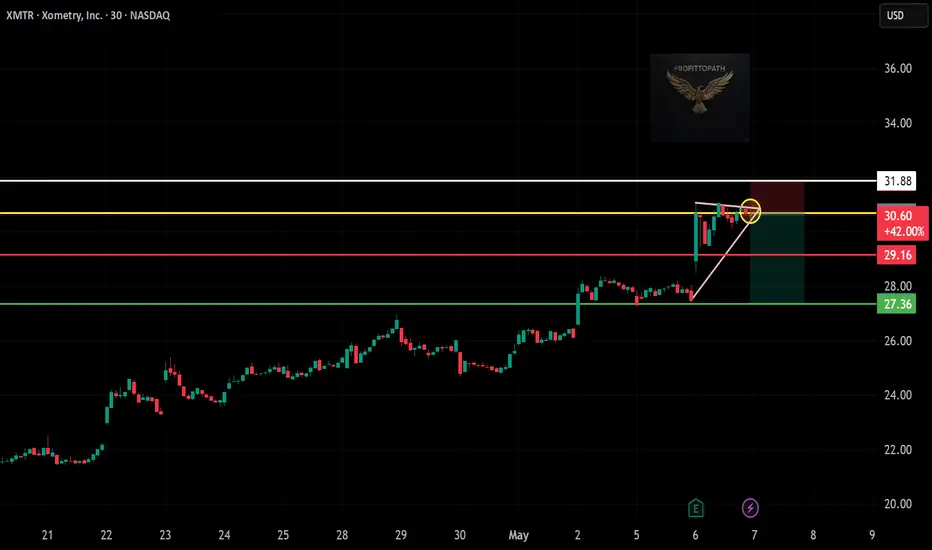
🔹 Asset: Xometry, Inc. (NASDAQ: XMTR)
🔹 Timeframe: 30-Minute Chart
🔹 Setup Type: Rising Wedge Breakdown
📌 Trade Plan (Short Position)
✅ Entry: Below $30.60 (Breakdown confirmation zone)
✅ Stop-Loss (SL): Above $31.88 (Wedge breakout invalidation)
🎯 Take Profit Targets:
📌 TP1: $29.16 – First minor support
📌 TP2: $27.36 – Key demand zone / breakdown target
📊 Risk-Reward Ratio Calculation
📉 Risk: $31.88 - $30.60 = $1.28
📈 Reward to TP1: $30.60 - $29.16 = $1.44 (1:1.1 R/R)
📈 Reward to TP2: $30.60 - $27.36 = $3.24 (1:2.5 R/R ✅)
🔍 Technical Highlights
📌 Rising wedge pattern broke down at top resistance
📌 Price rejected yellow zone (prior resistance)
📌 Bearish candle forming after retest
📌 Potential momentum shift if volume confirms
📉 Execution & Risk Strategy
📊 Wait for breakdown confirmation below $30.60
📉 Use trailing stop after TP1 hit
💰 Book partial profits at TP1, let rest run toward TP2
🚨 Invalidation Warning
❌ If price breaks back above $31.88 — exit
❌ Avoid early entry without solid bearish volume
🚀 Final Take
✔ Bearish setup forming with clean levels
✔ Solid 1:2.5 R:R potential
✔ Trade with discipline — let price confirm
Disclaimer
The information and publications are not meant to be, and do not constitute, financial, investment, trading, or other types of advice or recommendations supplied or endorsed by TradingView. Read more in the Terms of Use.
Disclaimer
The information and publications are not meant to be, and do not constitute, financial, investment, trading, or other types of advice or recommendations supplied or endorsed by TradingView. Read more in the Terms of Use.