Natural Gas Prices Fall to Yearly Low
Analysing the chart on 22 July, we constructed a descending channel and assumed that natural gas prices would continue to form a bearish market structure of lower highs and lower lows. Since then, the market has declined by almost 10%.
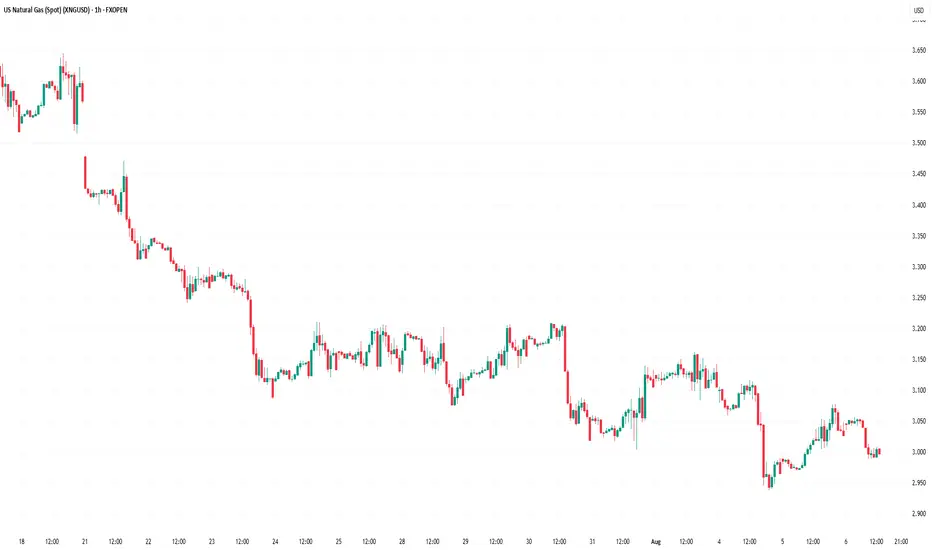
As the XNG/USD chart shows today, natural gas prices are hovering around the psychological level of $3.000/MMBtu. Earlier this week, gas was trading around $2.940/MMBtu — the lowest level of 2025.
According to media reports, the price decline is driven by both high production levels and favourable weather forecasts for August, the hottest month of the year. What might happen next?

Technical Analysis of the XNG/USD Chart
We have updated the descending channel, taking into account the recent fluctuations in natural gas prices.
The chart shows that bearish momentum remains intact — the rise from point B to C appears to be a corrective rebound within the prevailing downward trend, with the following developments:
→ point C formed in the 0.5–0.618 area, which corresponds to classic Fibonacci retracement levels following the A→B impulse;
→ the former support at 0.365 has now become resistance.
Bulls may hope that the current sentiment could shift following tomorrow’s natural gas storage report (scheduled for 17:30 GMT+3). A drop in inventories could potentially trigger a bullish impulse on the XNG/USD chart.
This article represents the opinion of the Companies operating under the FXOpen brand only. It is not to be construed as an offer, solicitation, or recommendation with respect to products and services provided by the Companies operating under the FXOpen brand, nor is it to be considered financial advice.
Analysing the chart on 22 July, we constructed a descending channel and assumed that natural gas prices would continue to form a bearish market structure of lower highs and lower lows. Since then, the market has declined by almost 10%.
As the XNG/USD chart shows today, natural gas prices are hovering around the psychological level of $3.000/MMBtu. Earlier this week, gas was trading around $2.940/MMBtu — the lowest level of 2025.
According to media reports, the price decline is driven by both high production levels and favourable weather forecasts for August, the hottest month of the year. What might happen next?
Technical Analysis of the XNG/USD Chart
We have updated the descending channel, taking into account the recent fluctuations in natural gas prices.
The chart shows that bearish momentum remains intact — the rise from point B to C appears to be a corrective rebound within the prevailing downward trend, with the following developments:
→ point C formed in the 0.5–0.618 area, which corresponds to classic Fibonacci retracement levels following the A→B impulse;
→ the former support at 0.365 has now become resistance.
Bulls may hope that the current sentiment could shift following tomorrow’s natural gas storage report (scheduled for 17:30 GMT+3). A drop in inventories could potentially trigger a bullish impulse on the XNG/USD chart.
This article represents the opinion of the Companies operating under the FXOpen brand only. It is not to be construed as an offer, solicitation, or recommendation with respect to products and services provided by the Companies operating under the FXOpen brand, nor is it to be considered financial advice.
Disclaimer
The information and publications are not meant to be, and do not constitute, financial, investment, trading, or other types of advice or recommendations supplied or endorsed by TradingView. Read more in the Terms of Use.
Disclaimer
The information and publications are not meant to be, and do not constitute, financial, investment, trading, or other types of advice or recommendations supplied or endorsed by TradingView. Read more in the Terms of Use.