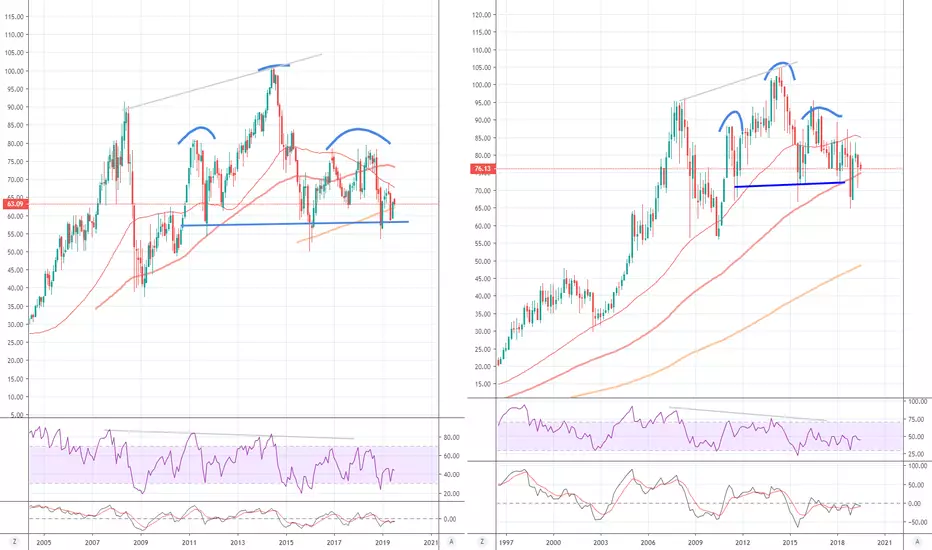
Classical chart patterns are not my strongest skill. However, seeing this H&S make me say mentally 'uh-oh'. My experience with H&S is that once the structure is completed price action gets brutal.
A similar thing is observed in OXY. CVX does not display H&S but demonstrates a lot of bearish bars (pins, engulfing) on M and 2M timeframe. XOM is challenging 200MA on M chart for the first time ever.
This post is not a trade rather than a piece of context for future short trades in energy.
A similar thing is observed in OXY. CVX does not display H&S but demonstrates a lot of bearish bars (pins, engulfing) on M and 2M timeframe. XOM is challenging 200MA on M chart for the first time ever.
This post is not a trade rather than a piece of context for future short trades in energy.
Disclaimer
The information and publications are not meant to be, and do not constitute, financial, investment, trading, or other types of advice or recommendations supplied or endorsed by TradingView. Read more in the Terms of Use.
Disclaimer
The information and publications are not meant to be, and do not constitute, financial, investment, trading, or other types of advice or recommendations supplied or endorsed by TradingView. Read more in the Terms of Use.