WEEKLY:
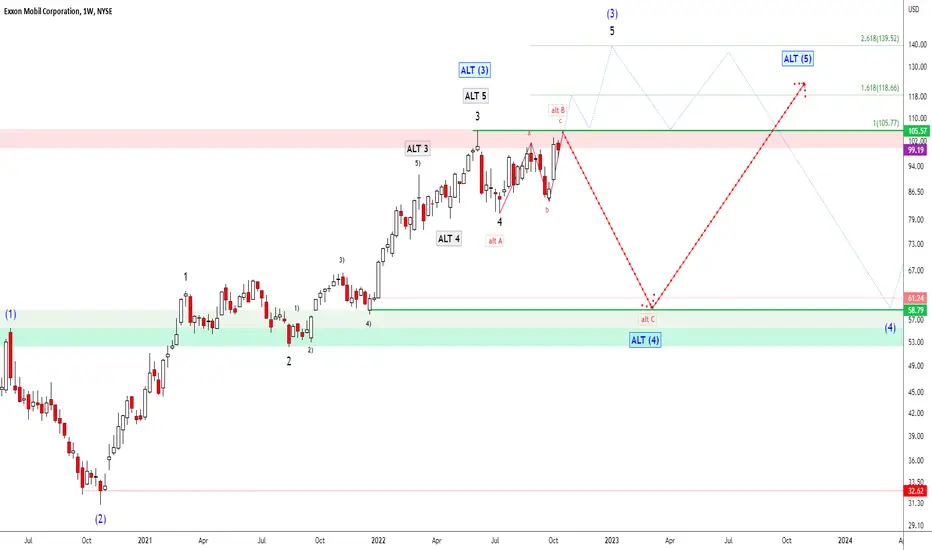
Since 2020, Exxon Mobil has started a strong uptrend and currently the trend is at the decision line, so I have outlined 2 variants on the chart: red and blue.
The blue path is suitable provided the @ 105.57 price level is soon broken to the upside which then continues the blue wave from Intermediate (1)-(5) to the end of wave (3).
The red variant comes into play when the alternative count of the black wave 1-5 is already complete at 105.57, which then - once the alt B ends - speaks for the falling ALT (4).
Disclaimer
The information and publications are not meant to be, and do not constitute, financial, investment, trading, or other types of advice or recommendations supplied or endorsed by TradingView. Read more in the Terms of Use.
Disclaimer
The information and publications are not meant to be, and do not constitute, financial, investment, trading, or other types of advice or recommendations supplied or endorsed by TradingView. Read more in the Terms of Use.