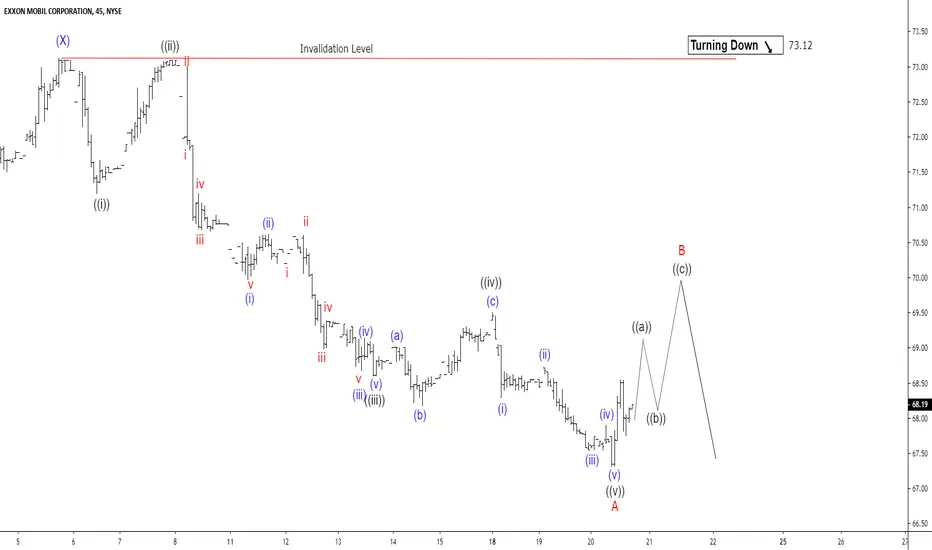
Exxon Mobil (ticker symbol:  XOM) shows an incomplete 5 swing Elliott Wave sequence from April 23, 2019 high favoring further downside. In the short term chart below, we can see the rally to $73.12 on November 6, 2019 ended wave (X). The stock then resumes lower. The structure of the decline from November 6 high is unfolding as a 5 waves impulse Elliott Wave structure. Down from Nov 6 high, wave ((i)) ended at 71.2 and wave ((ii)) rally ended at 73.09. The stock then continues lower in wave ((iii)) towards 68.6 with internal subdivided as an impulse in lesser degree. The bounce in wave ((iv)) ended at 69.50
Exxon Mobil finished wave ((v)) of A at 67.33 low. The stock is bouncing bounce in wave B to correct cycle from November 6 high before the decline resumes. As far as pivot at 73.12 high stays intact, expect rally in the stock to find sellers in the sequence of 3, 7, or 11 swing for further downside.
Exxon Mobil finished wave ((v)) of A at 67.33 low. The stock is bouncing bounce in wave B to correct cycle from November 6 high before the decline resumes. As far as pivot at 73.12 high stays intact, expect rally in the stock to find sellers in the sequence of 3, 7, or 11 swing for further downside.
14 days trial --> elliottwave-forecast.com/plan-trial/ and get Accurate & timely Elliott Wave Forecasts of 78 instruments. Webinars, Chat Room, Stocks/Forex/Indices Signals & more.
Disclaimer
The information and publications are not meant to be, and do not constitute, financial, investment, trading, or other types of advice or recommendations supplied or endorsed by TradingView. Read more in the Terms of Use.