Hello Traders
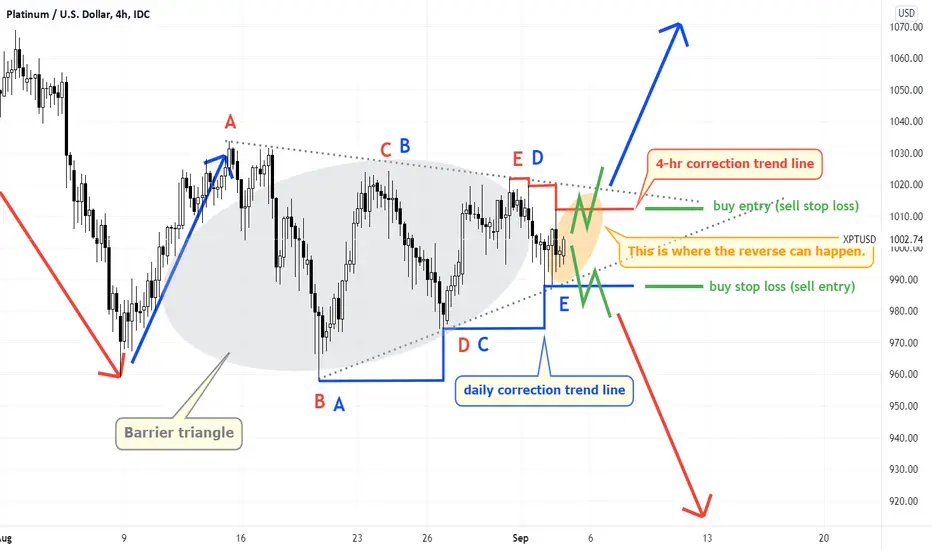
This is Platinum's 4-hour chart Time Wave analysis.
The correction you see now is a Barrier triangle pattern.
Both ups and downs are possible as we haven't yet left this triangle.
Because the daily correction trend line is drawn below
As long as it doesn't break that line, it can hold its upside for now.
When the correction is completed and the wave no longer travels in the original direction,
Reversal may come out.
If you are in a risk buy, your stop loss should be below the daily correction trend line.
good luck.
Disclaimer
The information and publications are not meant to be, and do not constitute, financial, investment, trading, or other types of advice or recommendations supplied or endorsed by TradingView. Read more in the Terms of Use.
Disclaimer
The information and publications are not meant to be, and do not constitute, financial, investment, trading, or other types of advice or recommendations supplied or endorsed by TradingView. Read more in the Terms of Use.