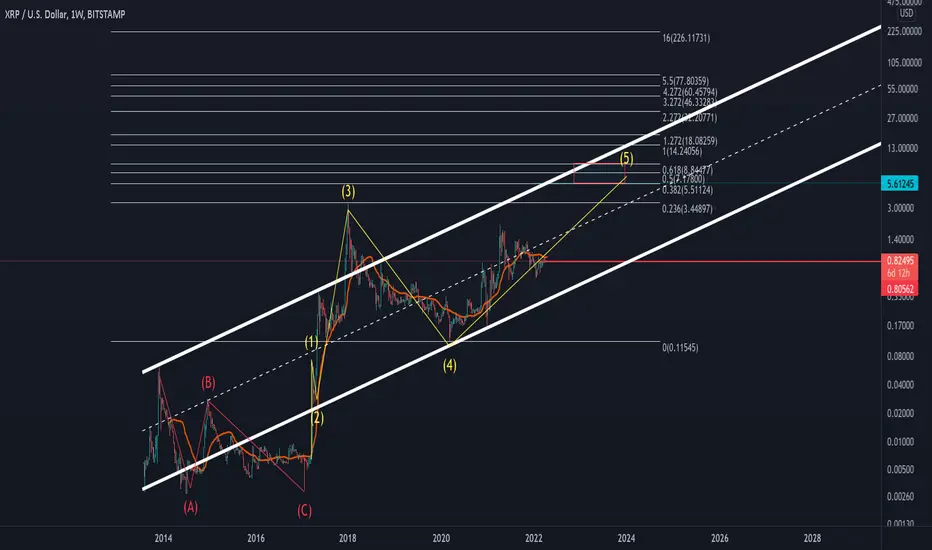
On this weekly chart I made a weird logarithmic channel based on median.
Actually XRP entering 5th impulsive wave.
Conditions for this wave are:
1) Hold above 80 cents
2) Break above 200 day moving average.
3) Positive result in SEC lawsuit ( seems good ).
4) Make new All Time High.
Every price action above this channel is overbuy( bubble),
everything below is strong oversell.
This chart was always hard to read with a lot of pin bars, sideways and quick accelerations.
Make your own decisions , take care and never risk too much.
Emvo.
*This is not a financial advice. Do not ever invest or trade by my ideas. It's on your own risk.
Note
As far as this 80 cents holding less or more, it is a very good sign. This is 1 hour chart.Daily 200 MA is close and should be tested maybe this week.Note
Note
Trade closed: stop reached
Falled to the bottom of channel.Disclaimer
The information and publications are not meant to be, and do not constitute, financial, investment, trading, or other types of advice or recommendations supplied or endorsed by TradingView. Read more in the Terms of Use.
Disclaimer
The information and publications are not meant to be, and do not constitute, financial, investment, trading, or other types of advice or recommendations supplied or endorsed by TradingView. Read more in the Terms of Use.