Traders,
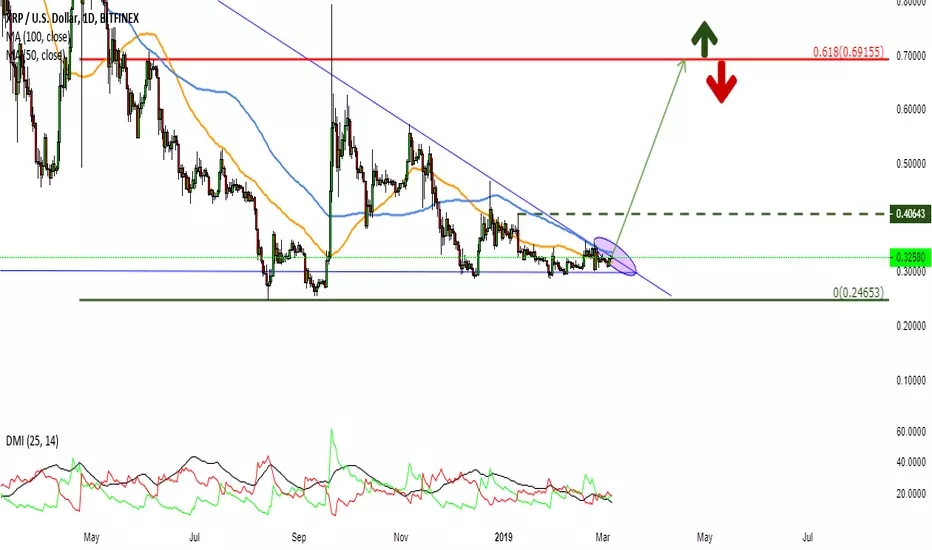
Here we have XRPUSD 1D chart.
In this chart we have a critical point at the ledge of the bear trend from temporary correction top happened April 2018 this point is will determine if we are going to have a new trend or failed to break it and return to bears here what am seeing according to this logical triangle pattern that breakout will make perfect return causing 50 - 100 crossover.
will update next few days, to see what the next candles tell us ?
Regards,
Mohsen
Trade active
Trade active
Trade active
Trade active
Market analysis, scalping calls, Binance Alts signals and real time news & Sentiment on:
Telegram: t.me/MO_Trading
Twitter: twitter.com/MoTradr
Telegram: t.me/MO_Trading
Twitter: twitter.com/MoTradr
Related publications
Disclaimer
The information and publications are not meant to be, and do not constitute, financial, investment, trading, or other types of advice or recommendations supplied or endorsed by TradingView. Read more in the Terms of Use.