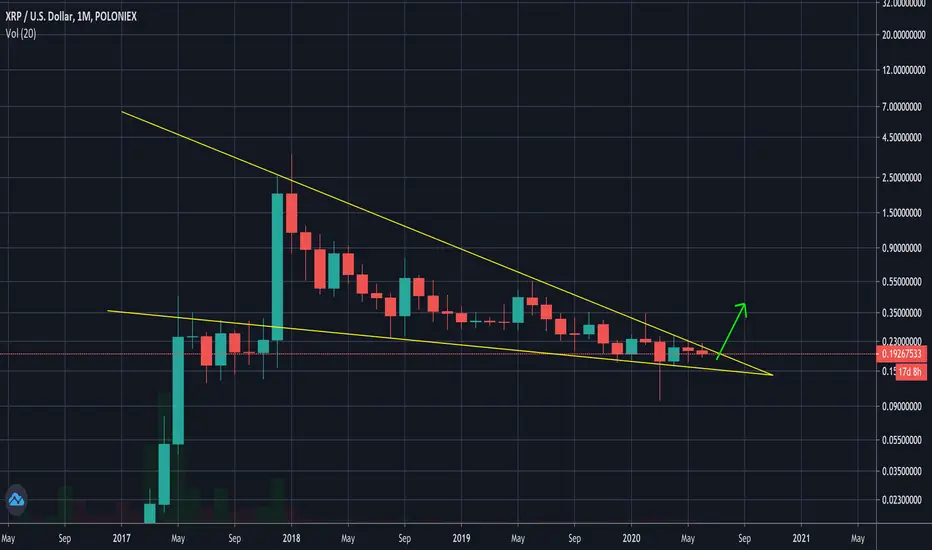
The XRPUSD monthly chart has formed a long descending wedge in the last 2 years since January 2018 (yellow lines). It is likely that this descending wedge is broken in the following weeks and get a reversal in the XRP price action.
Related publications
Disclaimer
The information and publications are not meant to be, and do not constitute, financial, investment, trading, or other types of advice or recommendations supplied or endorsed by TradingView. Read more in the Terms of Use.
Related publications
Disclaimer
The information and publications are not meant to be, and do not constitute, financial, investment, trading, or other types of advice or recommendations supplied or endorsed by TradingView. Read more in the Terms of Use.