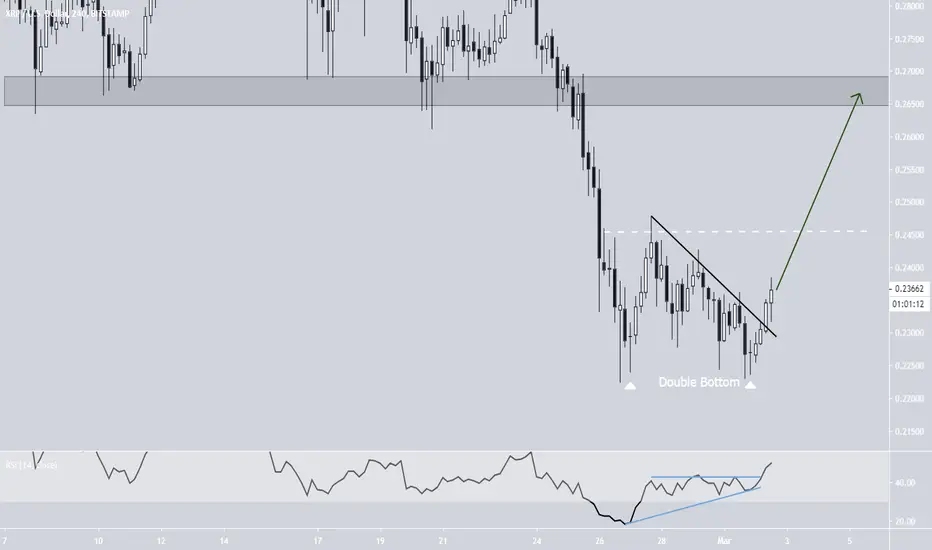
In the 4-hour chart we can see a that a double bottom has been formed (inside a support area visible in higher time-frames).
There are three reasons that I think the entire breakout of this double bottom will play out.
So, the first target would be at the high between the two bottoms ($0.245) while the second one at the previous breakdown level ($0.27).
There are three reasons that I think the entire breakout of this double bottom will play out.
- The pattern is combined with bullish divergence in the RSI.
The RSI has broken out from an ascending triangle
The price has broken out from a short-term descending resistance line
So, the first target would be at the high between the two bottoms ($0.245) while the second one at the previous breakdown level ($0.27).
Note
That definitely took longer than expected, but the first target is reached!
-RSI clearly above 50
-Possible ascending support line.
Expecting the price to get to the target within a week.
Disclaimer
The information and publications are not meant to be, and do not constitute, financial, investment, trading, or other types of advice or recommendations supplied or endorsed by TradingView. Read more in the Terms of Use.
Disclaimer
The information and publications are not meant to be, and do not constitute, financial, investment, trading, or other types of advice or recommendations supplied or endorsed by TradingView. Read more in the Terms of Use.